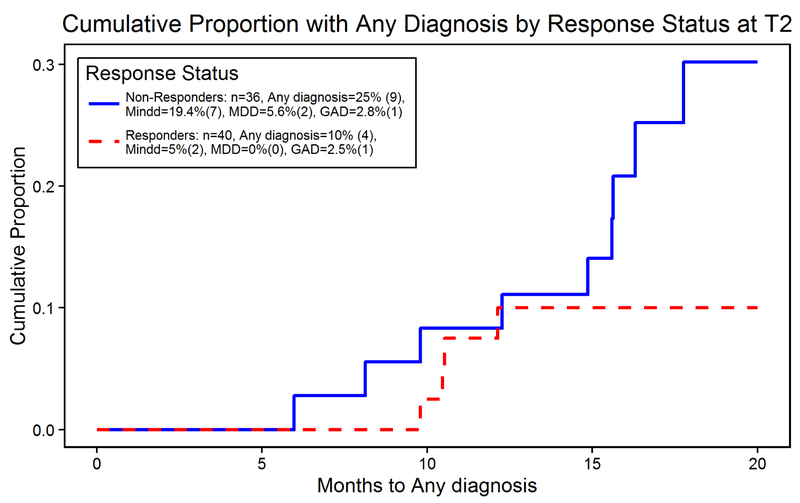
Figure 3: Cumulative proportion with any diagnosis comparing responders to non-responders.
Despite observed longer time without any diagnosis for responders compared to non-responders, the difference in the cumulative proportion with any diagnosis was not statistically significant (Logrank test z = −1.43, p = 0.153; HR for responders = 0.42; 95% CI 0.13−1.37)

