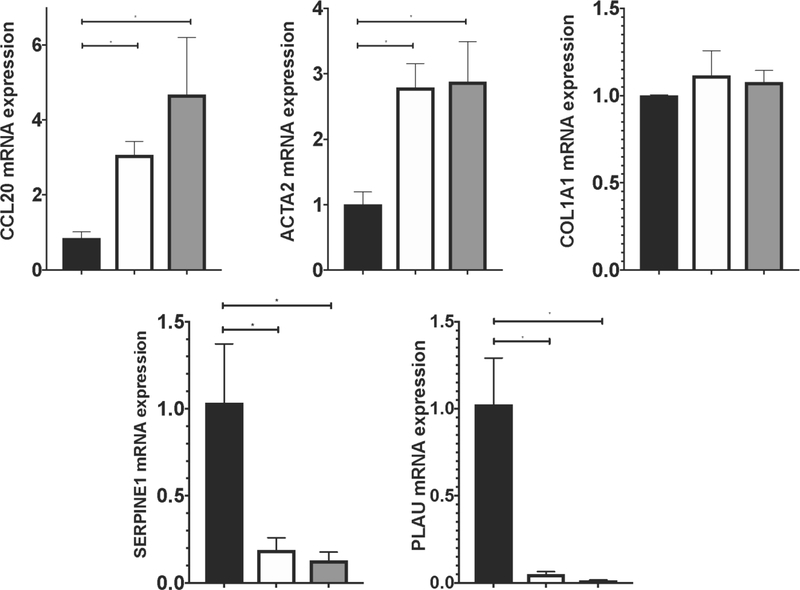
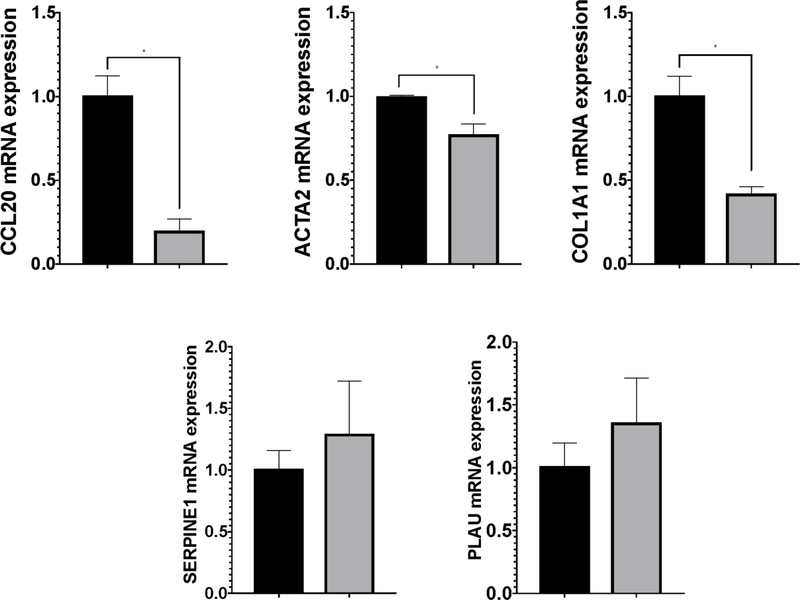
Figure 3. Effects of CCL20 on ECM components.
A) LX-2 cells were treated with 250 ng/mL (white bars), 1 μg/mL CCL20 (gray bars), or no treatment (NTC: black bars) for 48 hours and levels of CCL20, ACTA2, COL1A1, SERPINE1, and PLAU were measured by qPCR. B) LX-2 cells were transfected with 100 nM CCL20 siRNA for 72 hours. Black bars represent NTC and gray bars reflect cells treated with CCL20 siRNA. All experiments were performed in triplicate and data represent means ±SD. The Mann-Whitney U test was used to assess differences between conditions. *P<0.05.


