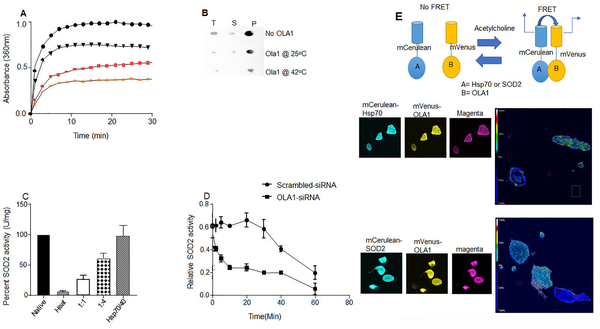
Figure 5.
OLA1 acts as a molecular chaperone. (A) Heat-dependence of OLA1 chaperone activity. Comparisons of inhibition of SOD2 aggregation by a 4-fold molar excess of OLA1 at indicated temperatures (saturation signal was normalized to 100) black circles (inactivated SOD2 without OLA1), black triangles (0.3μM OLA1), pink squares (0.6μM OLA1), and orange triangles (1.2μM) (inactivated SOD2+OLA1 at 37°C. (B) Dot blot analysis showing that the presence of OLA1 at a ratio that conveyed half-maximum or total aggregation suppression in light scattering assays prevented precipitation of SOD2 protein after heat-shock (1 hr at 65°C) (T=Total, S=Supernatant, P=Pellet. (C) Bar charts showing refolding of inactivated SOD2 protein in the presence of OLA1 and human Hsp70/40 system. (D) Line graphs showing decreased SOD2 activity in OLA1-silenced cells compared to scrambled-siRNA (n=4). (E) Schema for the FRET assay principle. Confocal images and analyses for FRET by photobleaching the acceptor, and the heat map shows the degree of interactions.

