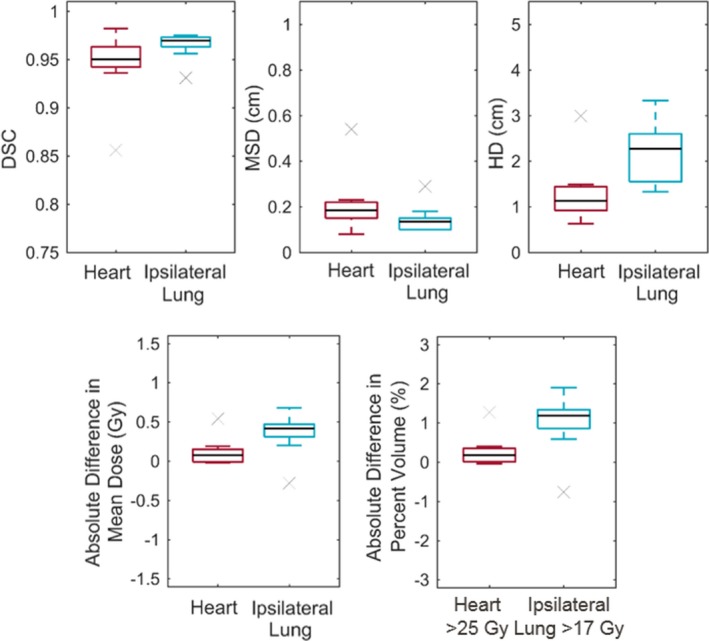
Figure 3.

Comparison of the automatically generated and physician‐approved contours of the heart and ipsilateral lung. The top row shows the following results of the geometric comparisons: Dice similarity coefficient (DSC; left), mean surface distance (MSD; center), and Hausdorff distance (HD; right). The bottom row shows the following results of the dosimetric comparisons: mean OAR dose (left) and dose–volume histogram metric (right). The absolute difference in metrics was the results for the physician‐approved contour minus that for the automatically generated contour for the same plan. [Color figure can be viewed at wileyonlinelibrary.com]
