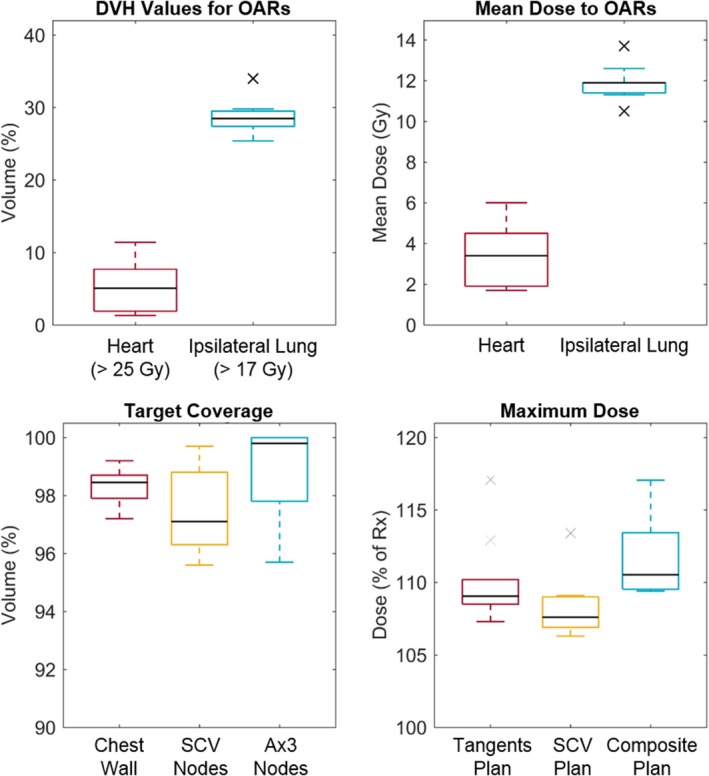
Figure 4.

The final dose metrics for the ten automatically planned treatments. The dose–volume histogram (DVH) metrics (top left), mean dose delivered to the heart and ipsilateral lung (top right), coverage of targets by 95% or the prescription dose (bottom left), and maximum doses for the tangential and SCV plans and for a composite of the two plans (bottom right) are shown. OARs, organs at risk; SCV, supraclavicular; Ax3, level III axillary; Rx, prescription. [Color figure can be viewed at wileyonlinelibrary.com]
