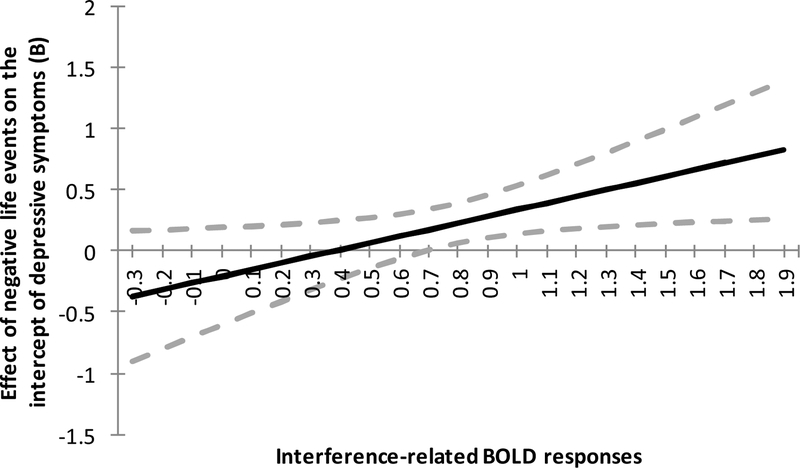
Figure 5.
Johnson-Neyman plot showing the moderating effects of interference-related BOLD responses (i.e., neural cognitive control) on the association between negative life events at Time 1 and the intercept of depressive symptoms. 95% confidence intervals are indicated by dashed lines. Scale goes from minimum to maximum of the interference-related BOLD responses (−0.24 to 1.81). Higher values of interference-related BOLD responses mean lower neural cognitive control.

