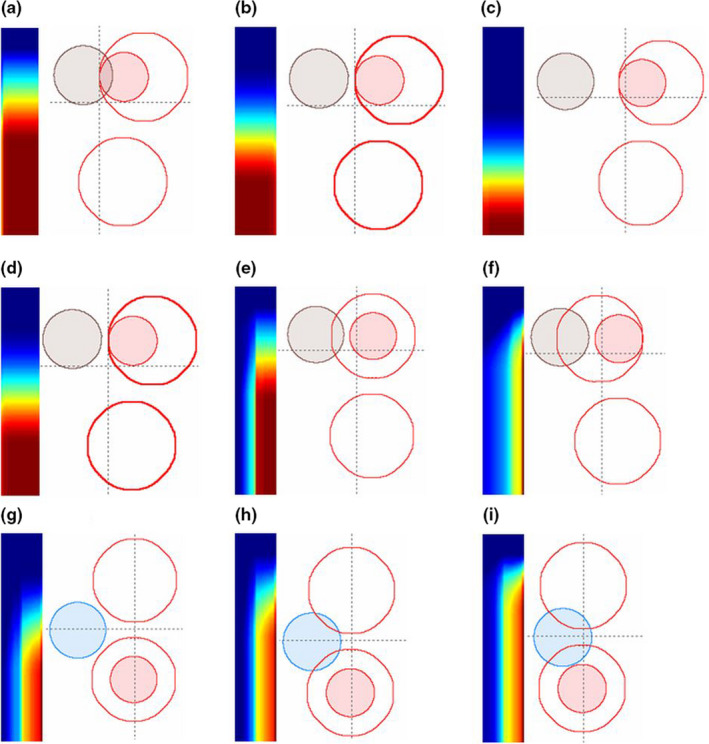
Figure 1.

Illustrations of the proposed gDTH feature with phantom data. (a)–(i): Nine phantom set up scenarios, with PTVs and OARs designated as coplanar spheres (see text for details). Red contours represent primary PTVs; red solid segments represent boost PTVs; and brown and blue segments represent OARs. Corresponding gDTHs are shown for each phantom case as two‐dimensional color maps. [Color figure can be viewed at wileyonlinelibrary.com]
