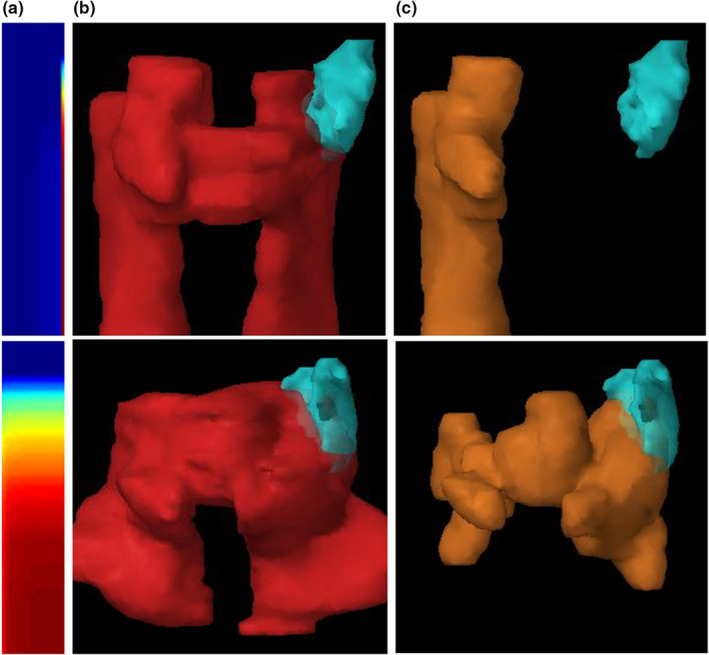
Figure 5.

Examples of clinical cases that can be synthesized by data augmentation. Top row: type A augmentation — since boost PTV (yellow) if far away from the OAR (cyan), the plan can be synthesized for various primary/boost dose prescription ratios, such as 44 Gy/ 70 Gy, 50 Gy/ 60 Gy. Bottom row: type B augmentation — since the boost PTV is at the same distance to the OAR as the primary PTV, a synthesized plan can be generated using the primary PTV as both primary and boost PTV. Columns from left to right: (a) gDTHs, (b) OARs (left parotids) shown with primary PTVs, (c) same OARs shown with boost PTVs. [Color figure can be viewed at wileyonlinelibrary.com]
