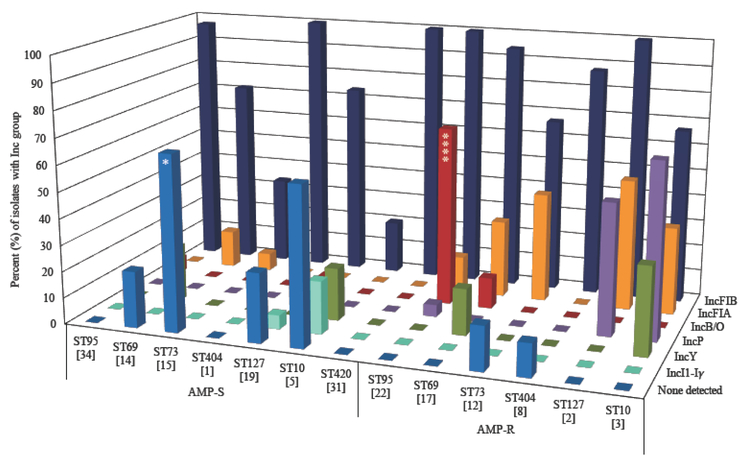
Figure 3.
Distribution of plasmid Inc groups among AMP-S and AMP-R E. coli from seven prevalent STs. Data for IncFIB, IncFIA, IncB/O, IncP, IncY, IncI1-Iγ, and no Inc detected are shown. The bar graph represents the percent of isolates within each group that contain the Inc type, while the values in parenthesis are the number of isolates per group. The P value compares the AMP-S group with the corresponding AMP-R group for each ST; *P<0.05, and ****P<0.0001.

