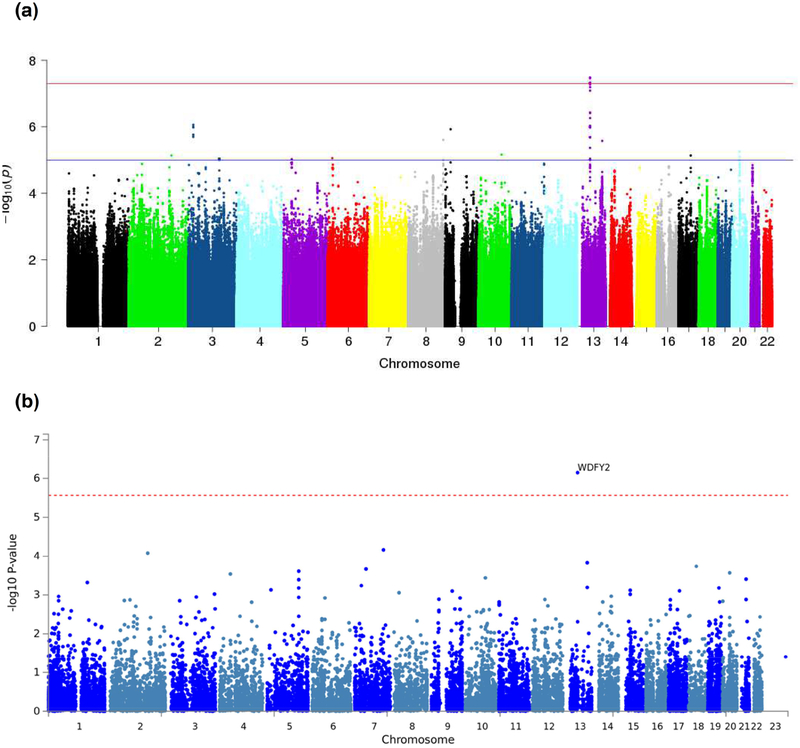
Figure 1:
(a) Manhattan plot showing the p-values of SNPs form genome-wide meta-analysis for the attention/processing speed domain. The red line represents the genome-wide significance threshold (p= 5E-08), and the blue line represents the suggestive significance threshold (p= 1E-05). (b) Manhattan plot showing the p-values of gene-based meta-analysis for the attention/processing speed domain. The red dotted line represents the gene-wide significance threshold (p= 2.71E-06).

