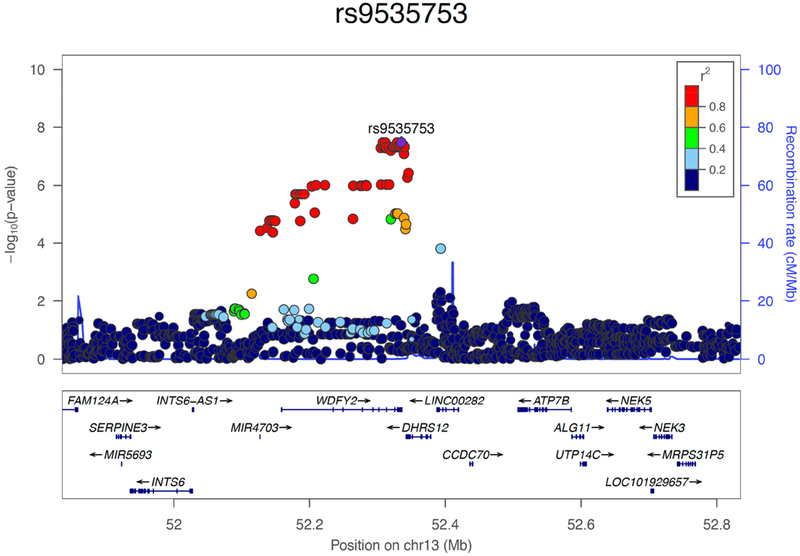
Figure 2:
Regional plot of the WDFY2 region on chromosome 13 in the meta-analysis of the attention/processing speed domain. The relative location of genes and the direction of transcription are shown in the lower portion of the figure, and the chromosomal position is shown on the x -axis. The light blue line shows the recombination rate across the region (right y -axis), and the left y axis shows the significance of the associations. The purple diamond shows the p-value for rs9535753 (p= 3.37E-08) that is among the most significant SNPs in the meta-analysis. The circles show the p-values for all other SNPs and are color coded according to the level of LD with rs9535753 in the 1000 Genome Project EUR population.

