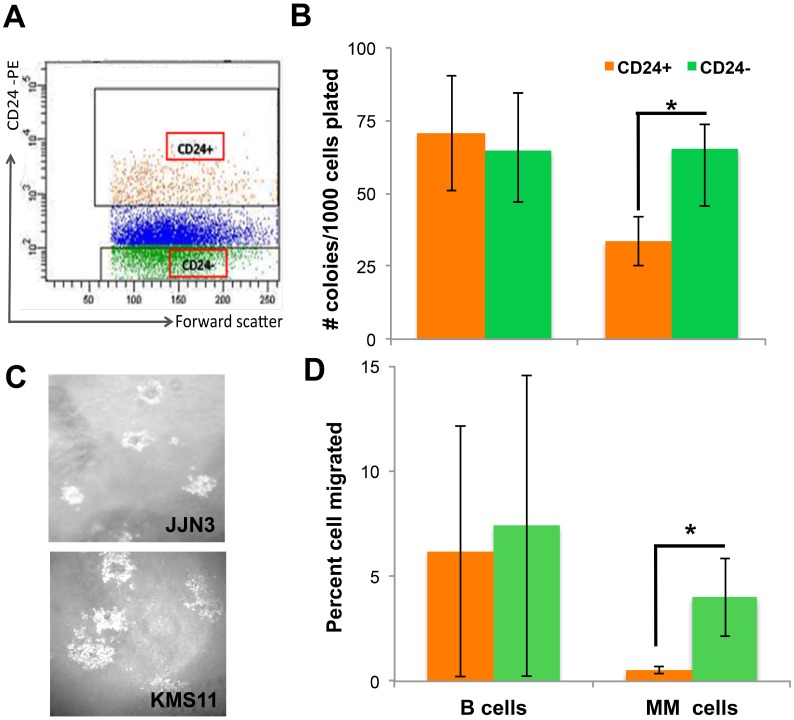
Figure 1. CD24 up-regulation on MM cells decreases tumorigenicity.
(A) Representative dot plot of gating strategy for sorting experiments of MM cell line. CD24+ - orange and CD24- green dots represent the populations that were sorted (B) Number of colonies (mean ± SEM) generated in methylcellulose from 1000 sorted CD24+ (orange) and CD24- (green) cells. B cells (n = 10) or MM (n = 16) were incubated for 5 days on BMSC generated from MM patients BM. Collected, stained and sorted for CD24 expression. (C) A representative image of colonies generated from JJN3 and KMS11 CD24+ cells lines. (D) Percent (mean ± SEM) of sorted CD24+ (orange) and CD24- (green) cells that migrated from 50,000 cells seeded. B n = 5) or MM (n = 5) cells were placed in the upper well of a two chamber Transwell incubated overnight to allow cells to migrate towards high fetal calf serum containing medium. *(P < 0.05).

