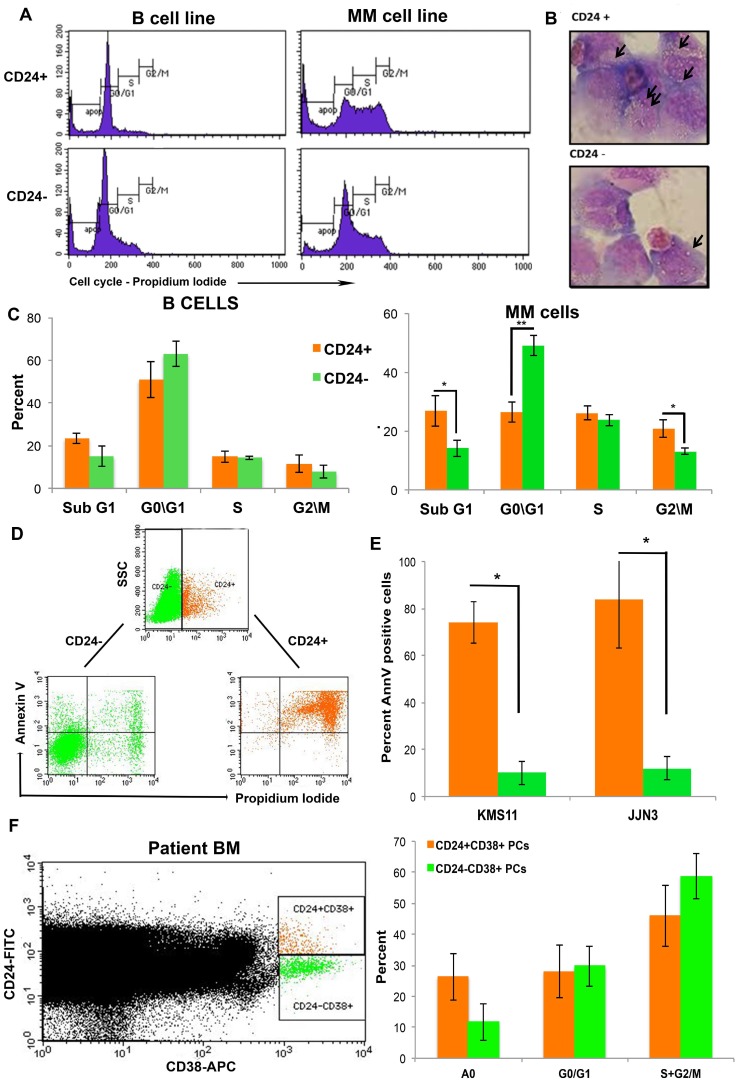
Figure 2. Up-regulation in CD24 expression correlates with increased apoptosis in MM cells.
(A) Representative histograms of 5 repeated experiments of cell cycle analysis of sorted CD24+ and CD24- B and MM cells (B). Representative image of the morphology of CD24+ and CD24- MM cells after May-Grumwald/Giemsa staining. Arrows point to vacuoles Note the increase in vacuoles in the CD424+ cells (magnification 100x) and (C) Quantitation of cell cycle results (mean ± SEM, n = 7) (D). Representative dot plot analysis of Annexin V and PI staining in MM cells (KMS11) after incubation for 5 days with BMSC from patient with MM. The cells were gated as CD24+ (orange) and CD24- (green) and analyzed for Annexin V/ PI. (E) Summary of the percent (mean ± SEM, n = 3) Annexin V+ cells in CD24+ (orange) and CD24- (green) gated fraction of MM (KMS11 and JJN3). (F) Representative dot plot of CD38+CD24+ (orange) and CD38+CD24- (Green) PCs in patients with multiple myeloma were assessed for percent apoptosis and cell cycle (n = 9, * P < 0.04)

