Figure 1.

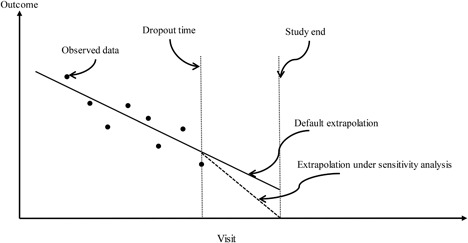
Graphical illustration of the default extrapolation under a typical SPM and the possible extrapolation under the proposed sensitivity analysis.

Graphical illustration of the default extrapolation under a typical SPM and the possible extrapolation under the proposed sensitivity analysis.