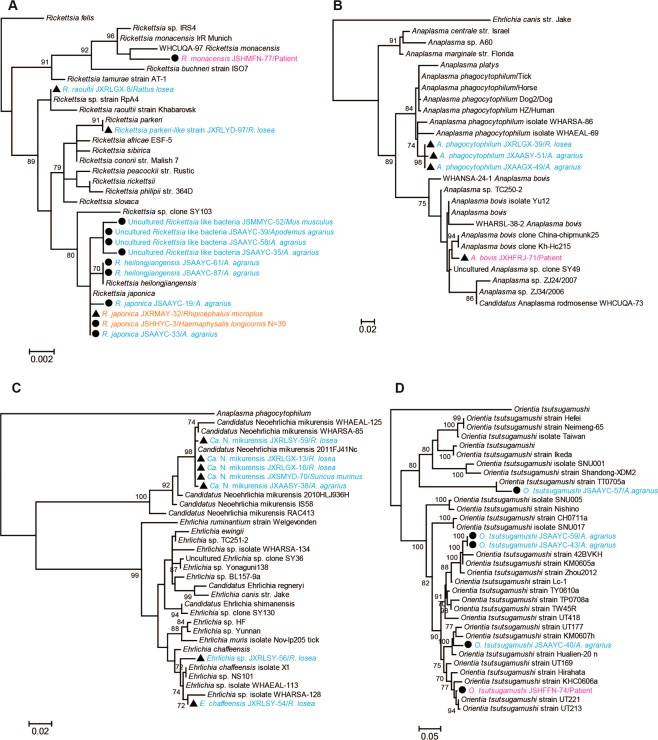
Figure 3.
Phylogenetic trees based on the partial rrs gene sequences of Rickettsia (A), Anaplasma (B), Ehrlichia (C), and the TSA56 gene sequences of Orientia tsutsugamushi (D). All trees were mid-point rooted for clarity only. Bootstrap values (>70%) are shown for appropriate nodes. The scale bar represents number of nucleotide substitutions per site. The sequences from patient samples are marked in red, those from rodents and shrews are marked in blue, and sequences from ticks are marked in orange.

