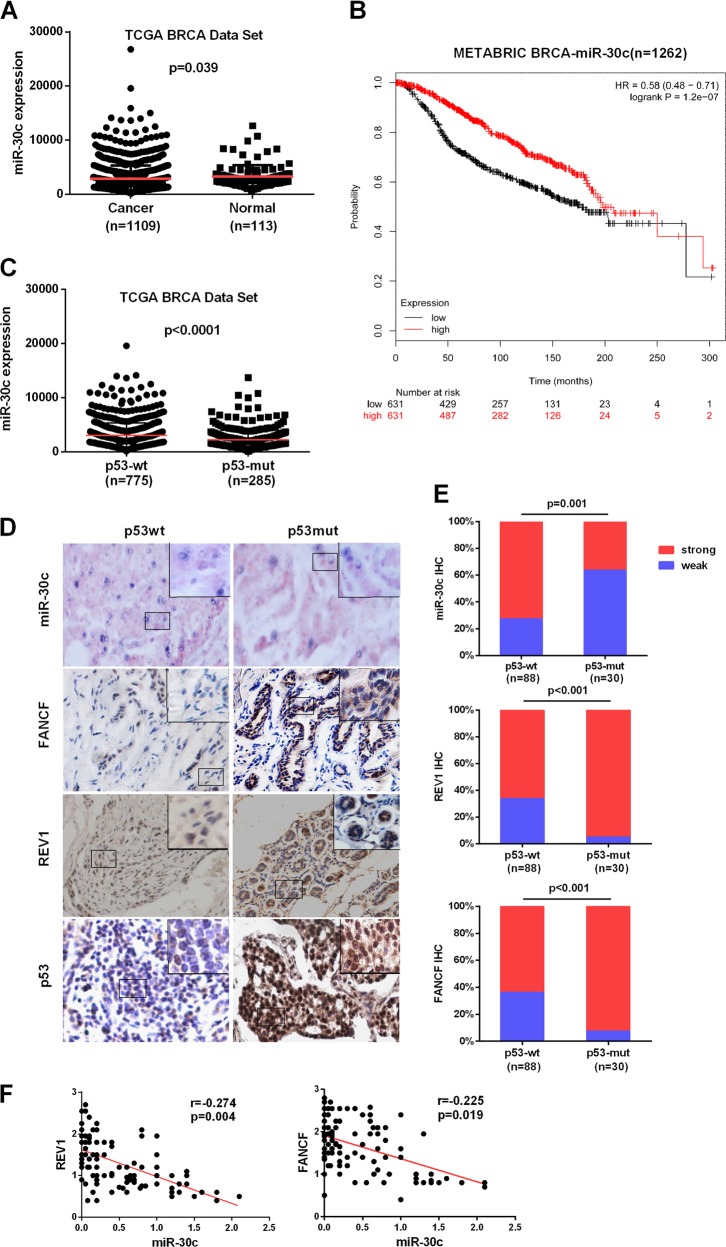
Fig. 6. Expression of miR-30c, FANCF and REV1 proteins is elevated in mutp53 specimens from patients with BrCa.
a miR-30c expression in normal breast tissues (n = 113) and BrCa tissues (n = 1109) in The Cancer Genome Atlas (TCGA) dataset. The p value was calculated via a nonparametric Mann-Whitney test. b Kaplan–Meier overall survival curves according to miR-30c expression in METABRIC BrCa patient cohorts. c A whisker plot showing miR-30c expression in patients with mutp53 tumors (n = 285) and wtp53 tumors (n = 775) using TCGA database. d Representative images of miR-30c in situ hybridization and FANCF and REV1 IHC for 118 cases of BrCa expressing wtp53 and mutp53. Magnification, ×200. Small frames indicate the magnified regions. e Quantitative data for miR-30c, FANCF and REV1 protein staining in d. Statistical significance was determined by Wilcoxon rank-sum tests. f Correlation analysis of miR-30c and REV1 or FANCF protein expression in BrCa patients

