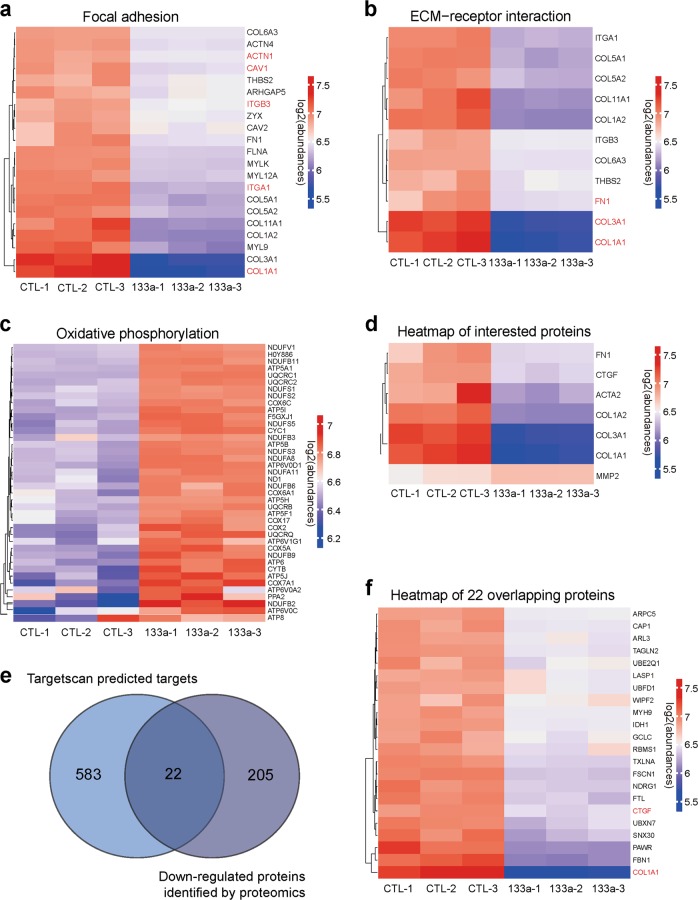
Fig. 4. Overexpression of miR-133a regulates multiple pathways in TGF-β1-treated HFL cells.
a–d Heatmap representing the log2 (abundances) of the differentially expressed genes in the selected KEGG pathways in miR-133a overexpressed HFL cells as compared to the CTL groups. The color key from blue to red represents the log2 (abundances) from low to high. e The overlap between Targetscan predicted miR-133a targets and miR-133a-down-regulated proteins identified by quantitative proteomics. f 22 overlapping proteins were analyzed and shown as Heatmap clusters

