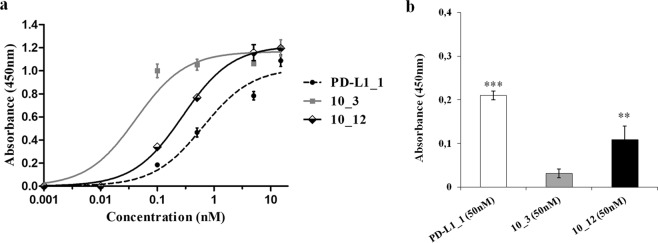
Figure 4.
Binding affinity of PD-L1_1 and its variants to human PD-L1 protein and mouse CT26 cancer cells. (a) ELISA assay on human PD-L1/Fc protein carried out with 10_3 (grey curve), 10_12 (black curve) or PD-L1_1 (dashed curve). (b) Cell ELISA on CT26 colon cancer cells to test the crossreactivity of 10_3 (grey bar) and 10_12 (black bar) mAbs compared to that of the parental PD-L1_1 (white bar). Error bars depicted means ± SD. P values for the indicated mAbs relative to untreated control, are: ***P ≤ 0.001; **P < 0.01.

