Figure 6.
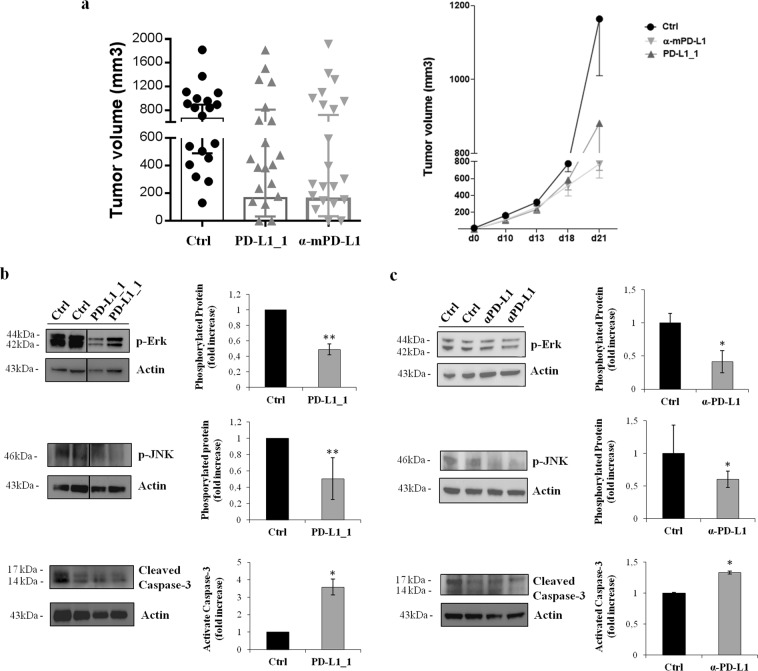
Effects of anti-PDL1 mAbs on tumor growth and signal transduction in CT26 tumors in vivo. (a) Tumor growth in mice inoculated sc with CT26 cells at day 0 and left untreated (black) or treated with PD-L1_1 (grey) or α-mPD-L1 (light grey). Shown is tumor volume for individual mice (n = 20) at day 21 (left panel) and mean of tumor volume for each group over time (right panel), *p = 0.02. Western blotting was performed on cell extracts from tumor specimens of two mice killed on day 21 from untreated groups or from responder groups treated with PD-L1_1 (b) or with α-mPD-L1 (c), as described in Methods. A line has been inserted to indicate distant lanes of the same gel (see Supplementary dataset). Protein levels are also expressed as fold increase with respect to those observed in untreated mice and normalized to actin. Error bars depicted means ± SD. P values for the indicated mAbs relative to cell extracts from untreated groups, are: ***P ≤ 0.001; **P < 0.01; *P < 0.05.

