Fig. 1.
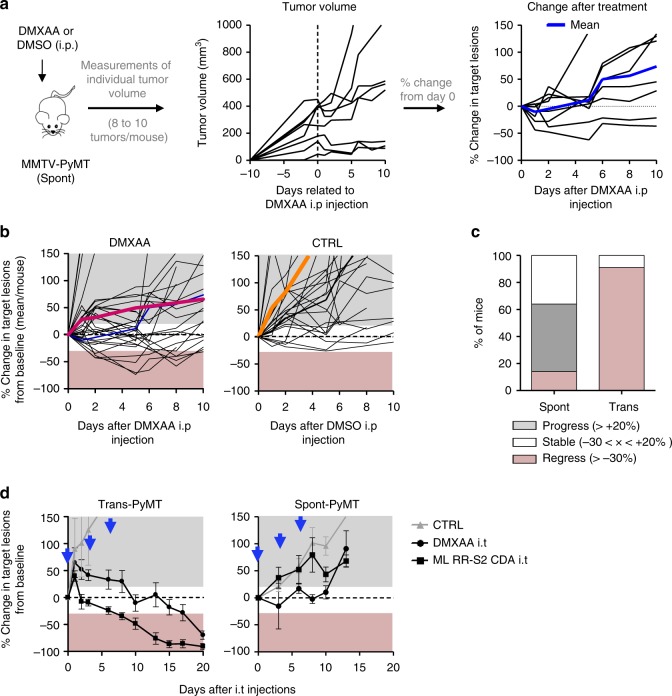
DMXAA does not induce a systematic regression of Spont-PyMT tumors. a Spont-PyMT mice were treated at day 0 with one i.p. injection of DMXAA or DMSO as a control. For each treated mouse, the changes in tumor size from baseline (d0) was calculated at each time point and expressed relative to the size at d0. The graphs in (a) provide an example of measurements obtained in one mouse treated with DMXAA i.p., with one curve per tumor. The average curve of all tumors of this mouse is shown in blue. The mouse clipart was created by N.B. b Each black curve corresponds to one mouse, and is calculated as the average relative tumor change for this mouse (as shown in a). The average curves for all the animals of a cohort are shown in red (DMXAA) or orange (CTRL). Overall progression (gray area) or regression (pink area) of tumor burden are indicated. Spont-PyMT mice: n = 30 (DMXAA), n = 25 (CTRL), from nine independent experiments. c The proportion of mice with, on average, regressing, stabilized or progressing tumors, are represented for these Spont-PyMT mice, in comparison with Trans-PyMT mice. Spont-PyMT mice: n = 30; Trans-PyMT mice: n = 26, from 9 to 10 independent experiments, respectively. d Intratumoral injection of DMXAA or ML RR-S2 CDA-induced tumor regression in Trans-PyMT mice, but not in Spont-PyMT mice. Trans- and Spont-PyMT mice were injected i.t. with DMXAA (1 × 500 µg, day 0) or ML RR-S2 (3 × 50 µg, at days 0, 3, and 6) or with HBSS i.t. as controls. Blue arrows: days of injections. The average fold change in tumor volume compared with baseline (day 0) is shown for each treated group. ML RR-S2 group (Spont-PyMT mice n = 4; Trans-PyMT mice n = 10), DMXAA (Spont-PyMT mice n = 3; Trans-PyMT mice n = 10), and HBSS/DMSO (Spont-PyMT mice n = 4; Trans-PyMT mice n = 6). The data are from three independent experiments for both tumor models. Source data are provided as a Source Data file

