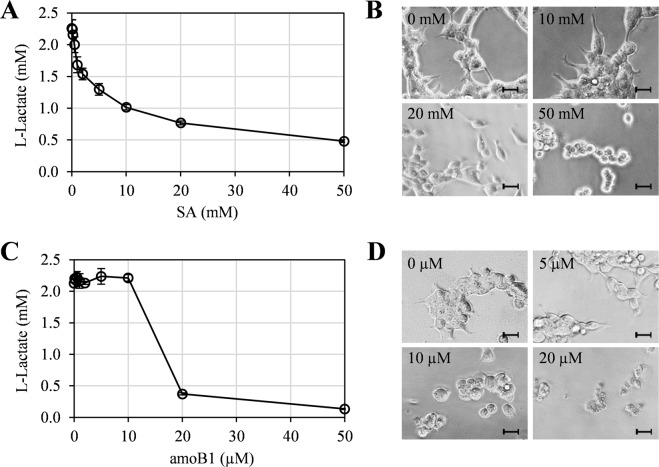
Figure 5.
Effect of SA and amoB1 on glycolytic activity and morphology of HEK293 cells. (A,C) Suppression of extracellular lactate production by SA (0, 0.1, 0.2, 0.5, 1, 2, 5, 10 and 20 mM) (A) or amoB1 (0, 0.1, 0.2, 0.5, 1, 2, 5, 10 and 20 µM) (C). Data are mean ± SD (n = 3). (B,D) Morphology of HEK293 cells treated 15 h with the indicated concentrations of SA (B) or amoB1 (D). Scale bar = 20 μm.

