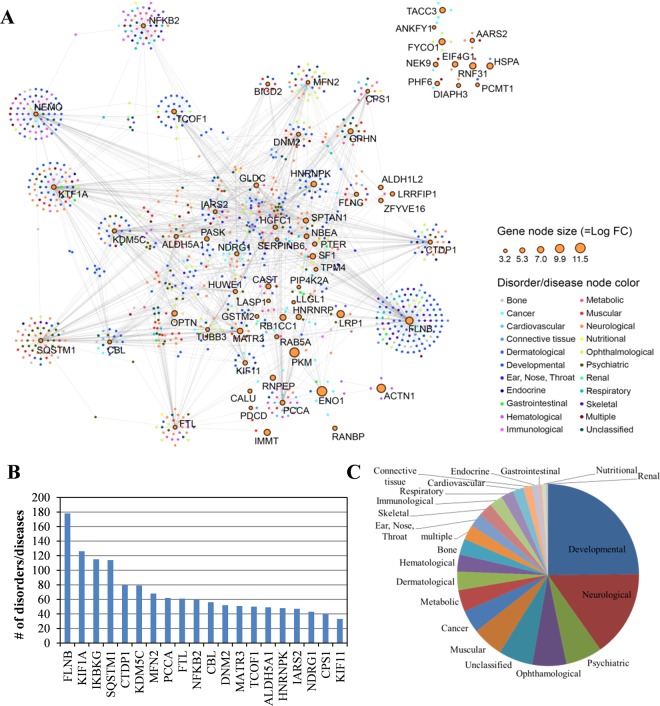
Figure 6.
Association of cSABPs with human disorders/diseases. (A) Human cSABP-disorder/disease network (SDN). In SDN, each node corresponds to a distinct cSABP (orange-colored circle with black outline) or human disorder/disease (which are color-coded). The cSABP node size is proportional to the enrichment level (Log FC) of the cSABP over that in the quantitative proteome database of HEK293 cells. The different disorders/diseases were grouped into 22 primary disorder/disease classes and color coded as shown on the right. cSABP nodes are linked to disorder/disease nodes by gray lines. For a complete set of names, see Supplementary Table S5. (B) The number of disorders/diseases associated with the 20 most implicated cSABPs. (C) A pie chart showing the relative number of disorders/diseases related to the 95 cSABPs.

