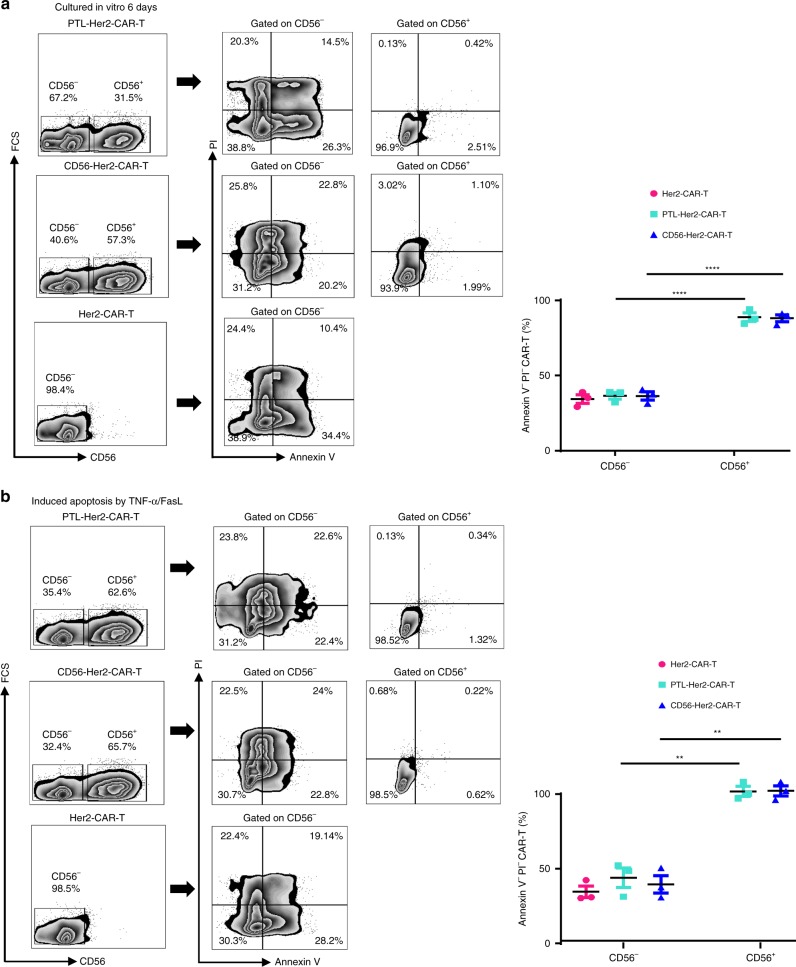
Fig. 6.
CD56 enhanced anti-apoptosis capability of CAR-T cells. a Left panel, the representative flow plots of apoptotic cell proportion in Her2-CAR-T, PTL-Her2-CAR-T, and CD56-Her2-CAR-T cells after culture for 6 days with cytokine deprivation. Right panel, the percentage of Annexin V− and PI− cells gated as in left panel. b Left panel, the representative flow plots of apoptotic cell proportion induced by TNF-α and FasL (10 ng ml−1) in various CAR-T cells. Right panel, the percentage of Annexin V− and PI− cells gated as in the left panel. **P < 0.01, ****P < 0.0001 (two-tailed Student’s t-test). All presented data summarizes mean ± SEM. Data shown are representative data from three independent experiments. The source data underlying a, b are provided as a Source Data file

