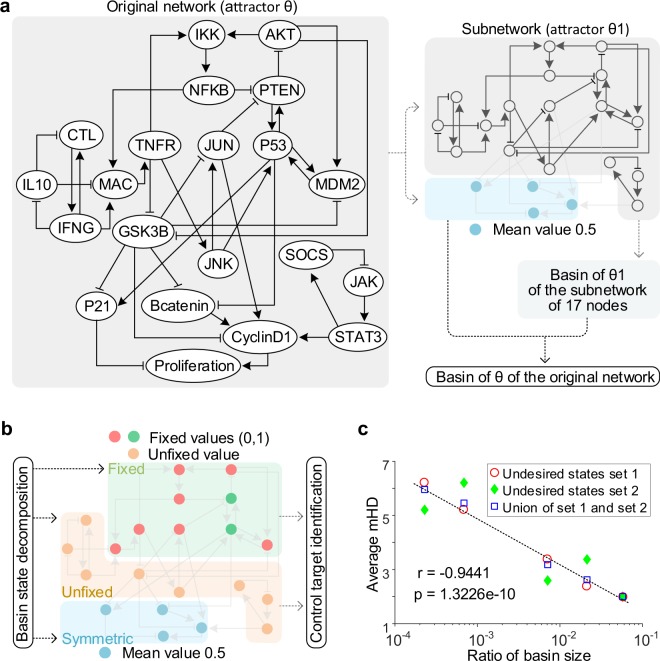
Figure 2.
BRC of a biomolecular network and the distribution of its average mHD. (a) The overall process to identify all the desired basin states of a reduced colitis-associated colon cancer network of 21 nodes (referred to as “CACC21”). Arrows and bar-headed lines in CACC21 represent activation and inhibition, respectively. Symbol θ denotes a desired attractor with Proliferation of value 0, which is given in Supplementary Data 1 and Fig. 4. In upper right, CACC21 is divided into a subnetwork and four symmetric nodes of mean value 0.5 (cyan circles), where state θ1 of the subnetwork indicates the reduced attractor state of θ (Supplementary Fig. 4). The concatenation of the four symmetric nodes and each basin state of the subnetwork are used to identify the exact basin of θ (dotted arrow in bottom right), which is explained in Supplementary Fig. 4. (b) Basin state decomposition to identify control targets. Each basin state is decomposed into three sub-states of “Fixed” (cyan), “Unfixed” (orange) and “Symmetric” (red, green) nodes where “Symmetric” nodes are obtained from the structure of CACC21 and the other nodes are obtained from the reduced basin of θ1. Only “Fixed” and “Unfixed” nodes are used to identify control targets (two arrows on the right side), which is explained in Supplementary Fig. 5. (c) Decrease of average mHD with increase in basin size. CACC21 has two undesired attractors having the state value 1 for Proliferation (Supplementary Data 1). The undesired states sets 1 and 2 denote the sets of states converging to each of the undesired attractors. The letters “r” and “p” denote Pearson’s correlation coefficient and P value, respectively. See Supplementary Data 1 for details.

