Figure 4.
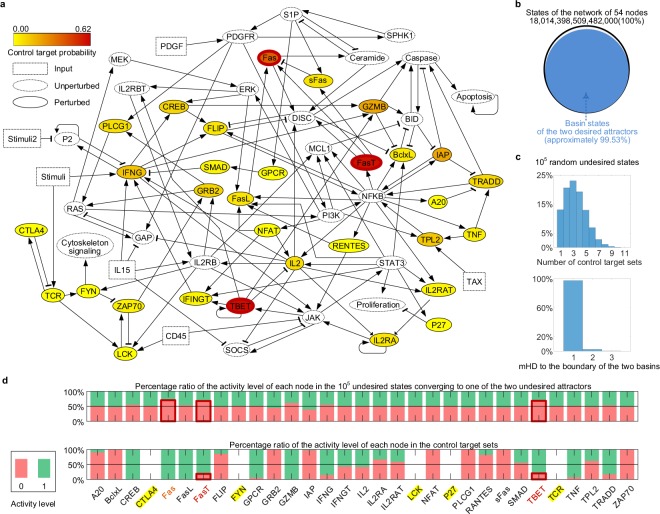
Application of BRC to the T-Cell54 network having a relatively large basin of the desired attractor. (a) T-Cell54 Boolean network with the probability of each node being a control target. Arrows and bar-headed lines represent activation and inhibition, respectively. Dotted rectangles denote input nodes where three inputs (Stimuli, IL15 and PDGF) are fixed to ON state and the remaining three inputs (CD45, Stimuli2 and TAX) are fixed to OFF. Dotted circles denote three outputs (Cytoskeleton signaling, Proliferation and Apoptosis), conceptual node P2 and known therapeutic target nodes for persistent intervention, which are not considered as candidates for temporary intervention targets. The remaining 31 nodes are marked with solid circles. 10,000,000 randomly selected initial states are used to find out undesired attractors (inactivated Apoptosis) and desired attractors (activated Apoptosis), which are given in Supplementary Data 3. The darker red color of a node indicates the higher probability of being included in control target sets given 100,000 randomly selected undesired states. (b) Sufficiently large size of the desired basin. Using the 10,000,000 randomly selected initial states, the total size of the basins of the desired attractors is approximately 99.53% (17,929,730,836,487,400 states). (c) Distributions of the numbers of control target sets and mHD. The average number of control targets is 3.3824 (standard deviation 1.6723). All the undesired states are situated at HD 3 at most and 97.35% of them have HD 1 to the desired basins. (d) Nodes enriched in control target sets. The activity levels range from 0 (inhibition) to 1 (activation). The top and bottom panels denote the activity level percentages of each node in the 100,000 randomly selected undesired states and the control target sets, respectively. The heights of boxes with red outlines in the two panels denote the activity level percentages of Fas, FasT and TBET (darker red colors in a) being contained in control target sets, which are the top 3 control target nodes. Nodes marked with yellow background (CTLA4, FYN, LCK, P27 and TCR) indicate non-target nodes (denoted by empties in the bottom panel).

