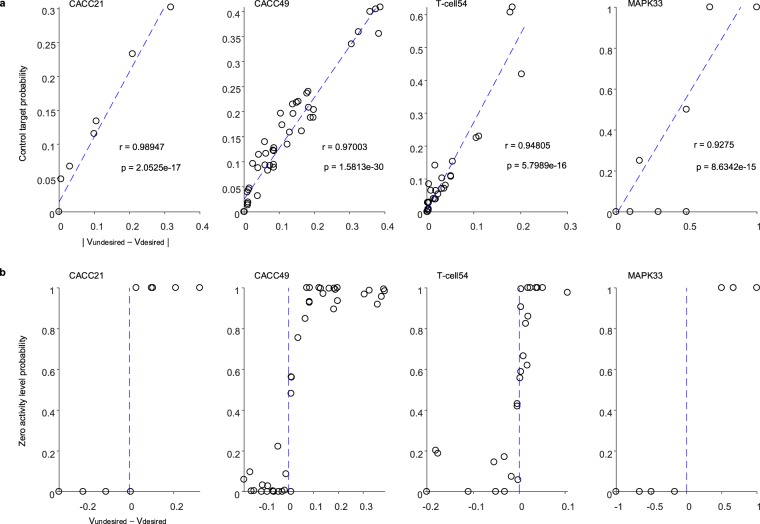
Figure 6.
Relation of control target and activity level probabilities with the difference of undesired and desired states. (a) Correlation analysis between control target probability and |Vundesired − Vdesired| of each node in CACC21, CACC49, T-cell49 and MAPK33 networks (Supplementary Data 1, 2, 3 and 4). Symbol Vundesired (Vdesired) denotes the mean value of a node state in all undesired (desired) states, where the undesired and desired states in CACC21, CACC49, T-cell49 and MAPK33 are defined in the previous subsections. |Vundesired − Vdesired| denotes the absolute value of difference between Vundesired and Vdesired of each node. Pearson’s correlation coefficients (r) and P values (p) indicate a strong positive correlation. (b) Relation between zero activity level probability and Vundesired − Vdesired of each node in CACC21, CACC49, T-cell49 and MAPK33 networks (Supplementary Data 1, 2, 3 and 4). The zero activity level probability of a node denotes the probability that the node’s value is 0 in all the control target sets, which tends to increase as Vundesired − Vdesired increases.

