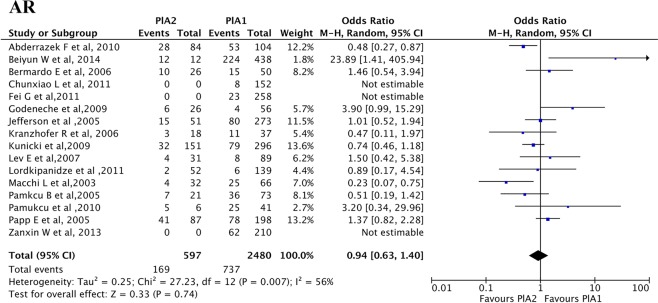
Figure 2.
Association between PlA1/A2 polymorphism and laboratory aspirin resistance. The position of the blue squares corresponds to the odds ratio (OR) per study and the horizontal black line to the 95% confidence intervals (CI). The size of the square is proportional to the relative weight of that study w(%) to compute the overall OR (black diamond). The width of the diamond represents the 95% CI of the overall OR. If a 95% CI spans one (indicated by the black vertical solid line), this study has found no significant difference in the incidence of aspirin resistance (AR) between patients carrying the PlA1 and PlA2 alleles. This meta-analysis shows no significant change in the incidence of AR of patients carrying the PlA2 allele over those carrying PlA1 allele. The overall OR is 0.94 (P = 0.74). Note that the p-value mentioned here is the p-value for Z test.

