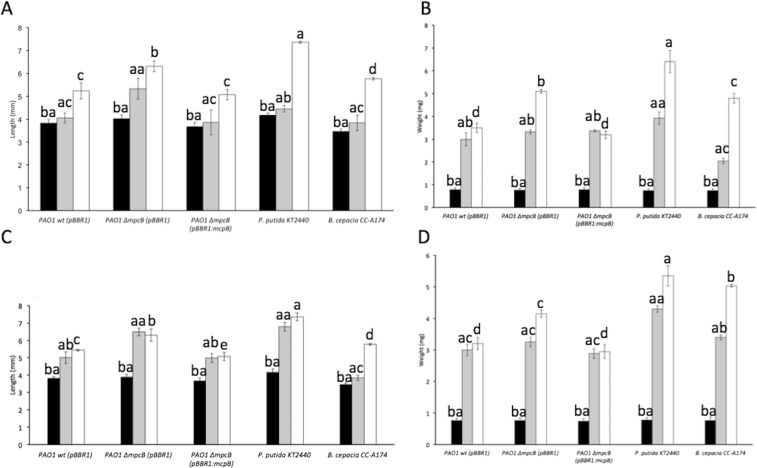
Figure 4.
Length and weight of A. bipunctata and C. carnea individuals fed with different bacterial strains. Virulence assays against A. bipunctata (A,B) and C. carnea (C,D) are shown. Measurements were made 0 (dark bars), 7 (grey bars), and 14 days (white bars) after feeding. Means and standard deviations of five biological replicates are shown. Data were submitted to an ANOVA test (posthoc Tukey) and significant differences (P ≤ 0.05) are highlighted by different single letters (after 14 days), double letters starting with a (after 7 days), and double letters starting with b (time zero). B. cepacia and P. putida KT2440 were used as pathogenic and non-pathogenic bacterial controls, respectively.

