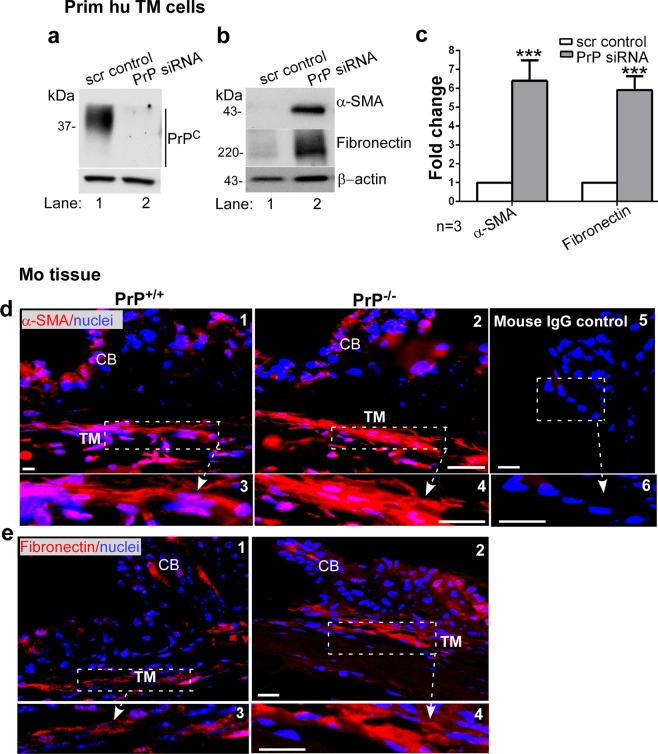
Figure 5.
Downregulation of PrPC upregulates α-SMA and fibronectin in the TM. (a) Probing of TM cell lysates treated with scrambled and PrP-siRNA for PrPC shows the expected glycoforms in the scrambled control, and minimal reactivity for PrPC in the experimental sample (lanes 1 & 2). (b) Probing of the same lysates for α-SMA and fibronectin shows upregulation in the absence of PrPC relative to controls (lanes 1 & 2). (c) Quantification of protein expression by densitometry after normalization with β-actin shows 6.1-fold and 5.9-fold upregulation of α-SMA and fibronectin respectively. Values are mean ± SEM of the indicated n. *p < 0.05, **p < 0.01. Full-length blots (Supplementary Fig. S2). (d & e) Immunoreaction of fixed sections from the anterior segment of PrP+/+ and PrP−/− mice shows stronger reactivity for α-SMA and fibronectin in the TM of PrP−/− relative to PrP+/+ samples (panel 1 vs. 2). Scale bar: 25 µm. No reaction was detected in samples reacted with mouse IgG followed by Alexa 546-conjugated secondary antibody (panels 5 & 6).

