Fig. 1.
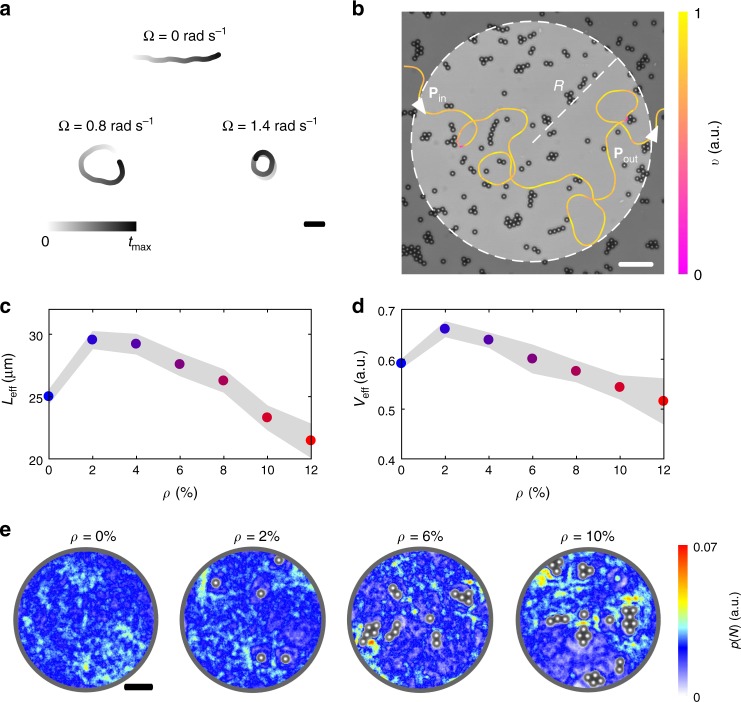
Propagation and localisation of E. coli cells near surfaces with micro-obstacles. a Exemplary 10-s-long trajectories of E. coli cells swimming near a surface in the absence of obstacles (ρ = 0%) for different angular speeds Ω. The case for Ω = 0.8 rad s−1 corresponds to the average value of angular speed in our experiments. The shading represents the trajectory’s time evolution. The black scale bar corresponds to 20 μm. b Exemplary trajectory of an E. coli cell swimming near a surface with fixed obstacles. The trajectory’s colour code represents the cell’s instantaneous velocity v normalised to its maximum value. The white dashed line delimits a circular area of radius R in the field of view and intersects the trajectory at points Pin and Pout, which respectively represent the cell’s points of entrance and exit in the circular area. This geometrical configuration is used for the calculation of the average effective propagation distance Leff in c and normalised speed Veff in d (Methods). The white scale bar corresponds to 20 μm. c, d Average effective propagation distance Leff and normalised speed Veff as a function of the obstacle density ρ for a circular area of radius R = 25 μm. Each value is obtained from averaging over at least 1000 different trajectories. The shaded area around the average values represents one standard deviation. The values of obstacle density ρ ≥2% are given with a 0.6% standard deviation. e Spatial probability density maps p(N) of finding individual bacterial cells within a circular area of radius R = 25 μm for increasing obstacle densities ρ over 1-h-long experiments. Each map was calculated from at least 450 different trajectories and an occupied pixel was only accounted for once for each trajectory. The black scale bar corresponds to 10 μm

