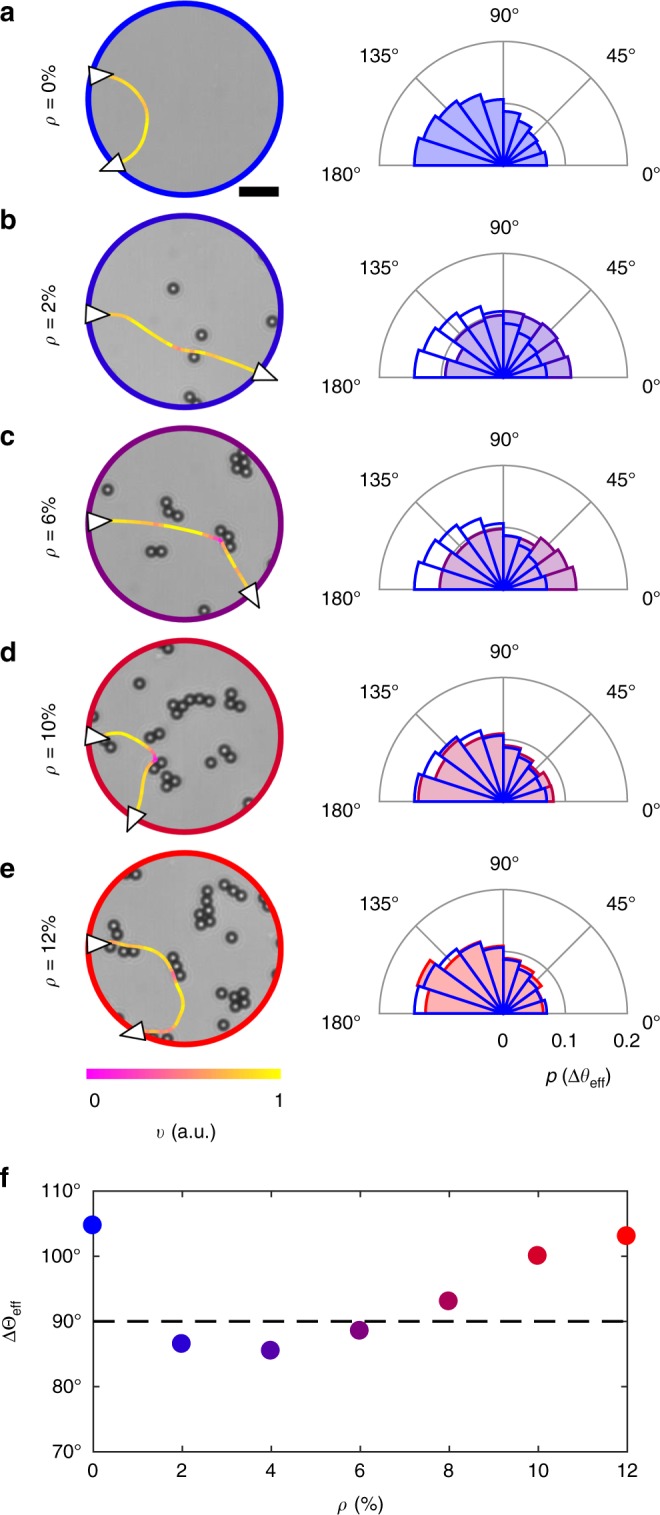
Fig. 2.

Change in effective propagation direction for E. coli cells near surfaces with micro-obstacles. a–e Exemplary trajectories and probability distributions of the change in effective propagation direction Δθeff for E. coli cells swimming through a circular area of radius R = 25 μm for different obstacle densities ρ: a ρ = 0%, b ρ = 2%, c ρ = 6%, d ρ = 10% and e ρ = 12%. The white triangles on the trajectories represent the direction of motion when entering and exiting the circular area, while the colour code of the trajectories represents the cells’ instantaneous velocity v normalised to its maximum value. The black scale bar in a corresponds to 10 μm. Each distribution is obtained from at least 1000 different trajectories, and Δθeff = 90° separates between forward (Δθeff < 90°) and backward (Δθeff > 90°) propagation. For reference, the distribution in a is also shown in b–e as a solid line. f Average change in effective propagation direction ΔΘeff = 〈Δθeff〉 as a function of ρ calculated from the previous probability distributions. The dashed line at 90° represents the separation between forward and backward propagation
