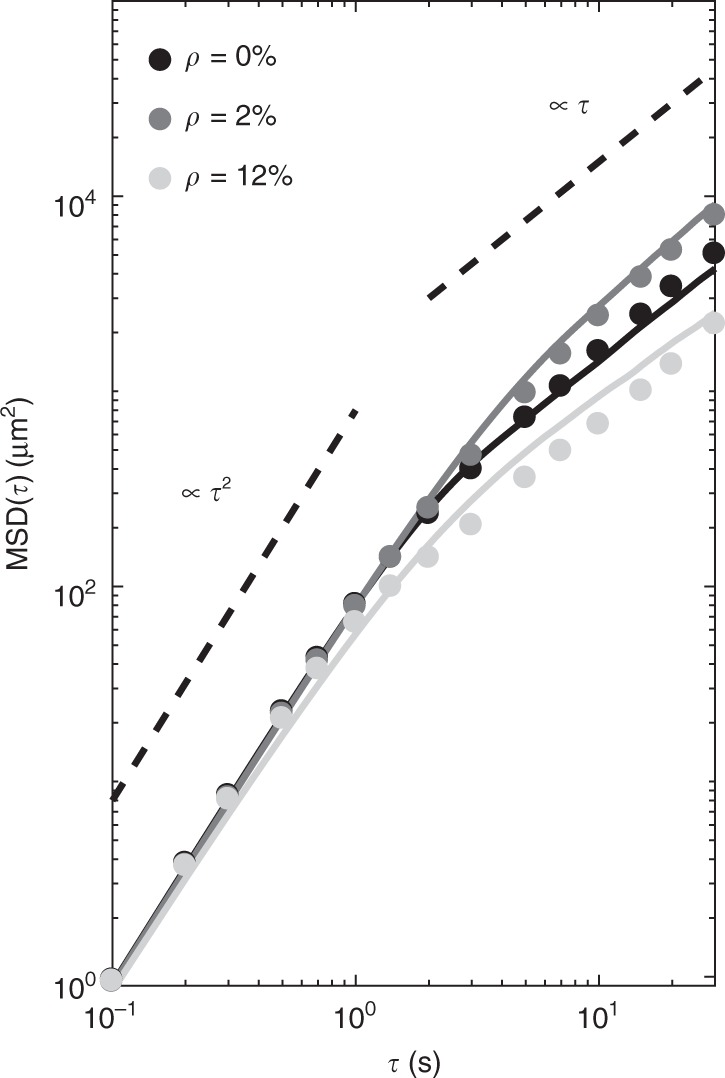
Fig. 8.

E. coli cells’ mean square displacement for different obstacle densities. Average mean square displacements (MSDs) of E. coli cells swimming on a smooth surface (ρ = 0%), in the presence of a few obstacles (ρ = 2%) and at higher obstacle densities (ρ = 12%) in experiments (circles) and simulations (solid lines). The MSD at ρ = 2% shows a clear enhancement in diffusivity for the cells when compared to the MSD at ρ = 0%. The MSDs calculated from simulated trajectories match well the experimental ones. Both in experiments and simulations, the MSD at ρ = 12% shows a decrease in diffusivity when compared to the MSD at ρ = 0%. This decrease is lower in simulations rather than in experiments as our model does not account for the fact that, in experiments, cells can stop at an obstacle for a prolonged period of time, thus inducing a stronger transient subdiffusive behaviour. The two dashed lines, respectively, show ballistic (∝τ2) and diffusive (∝τ) behaviour for reference. Each experimental MSD curve was obtained as an ensemble average over at least 30 trajectories (each at least 30 s long), while each simulated MSD curve was calculated as an ensemble average over 20,000 trajectories (each 30 s long) obtained from 200 different obstacle configurations with 100 non-interacting particles each (Methods)
