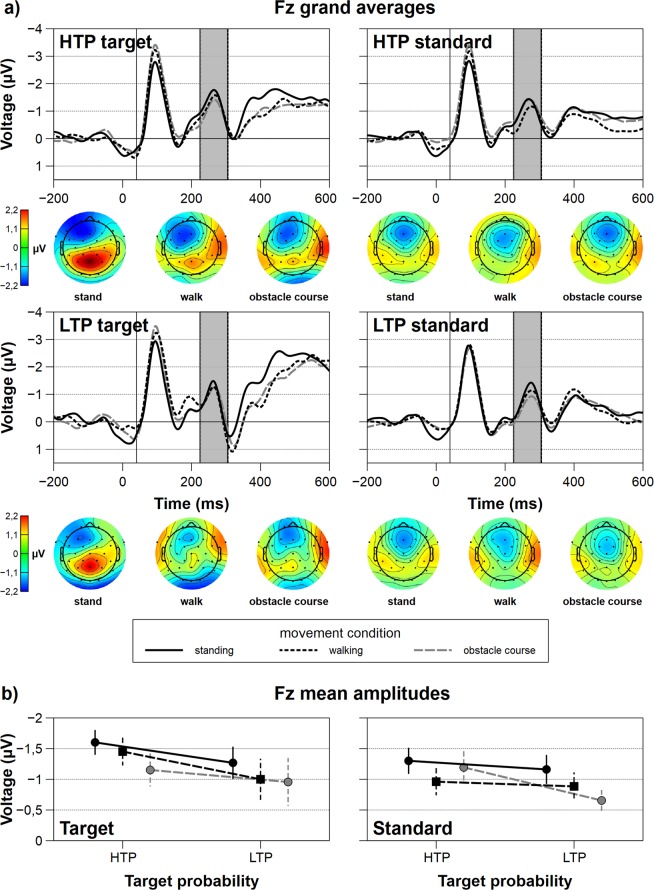
Figure 3.
Frontal grand average ERPs in the N2 window and interaction plots for all factorial combinations. (a) Grand average N2 ERPs at Fz for all movement, target type and target probability conditions. The grey rectangles indicate the time windows for averaging. The topographies underneath the ERP-plots depict movement complexity specific voltages on the scalp in the N2 time-window. (b) Interaction plots for the N2 average amplitudes at Fz. Error bars depict the standard error. HTP: high target probability (35%), LTP: low target probability (20%).

