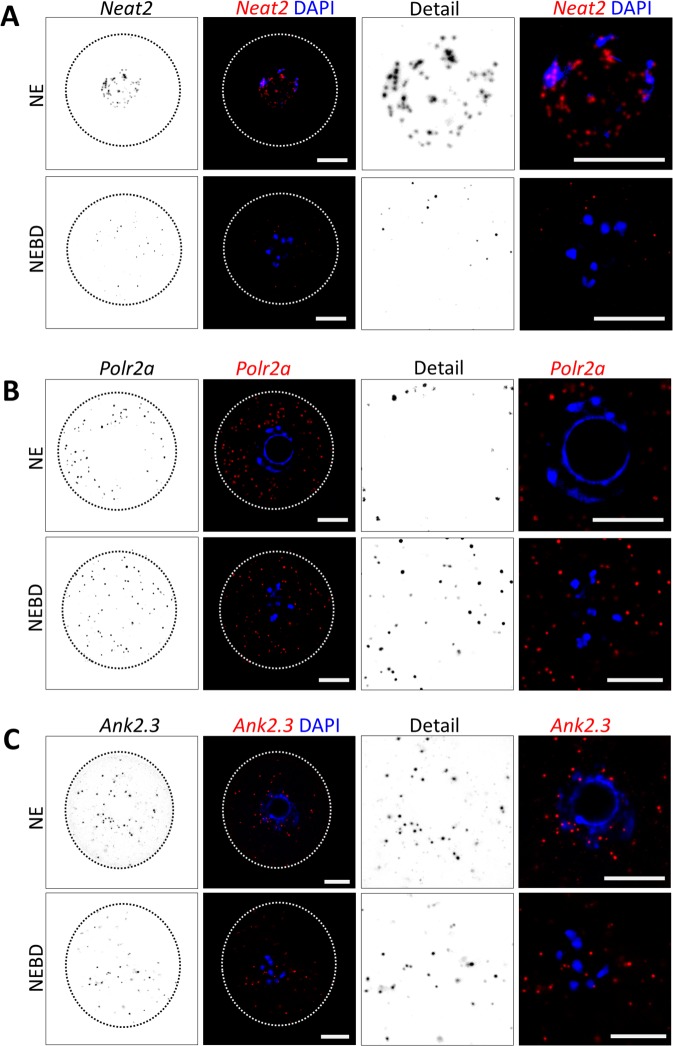
Figure 2.
Localization of lncRNA Neat2 and mRNAs coding for Polr2a and Ank2.3 in NE and NEBD oocytes. Single Z-scan confocal images from RNA FISH for (A) Neat2 RNA (B) Polr2a mRNA and (C) Ank2.3 mRNA in NE (0 h) and NEBD (nuclear envelope breakdown; 3 h) oocytes. RNA in grey and red and DNA in blue (DAPI). The cortex of the cell is depicted by a black or white dotted line. Representative images from at least three independent experiments (n ≥ 18), scale bar = 20 μm. Bacterial DapB RNA (Bacillus subtilis, str. SMY; EF191515.1) was used as a negative control. See also Suppl. Fig. 1C,D.

