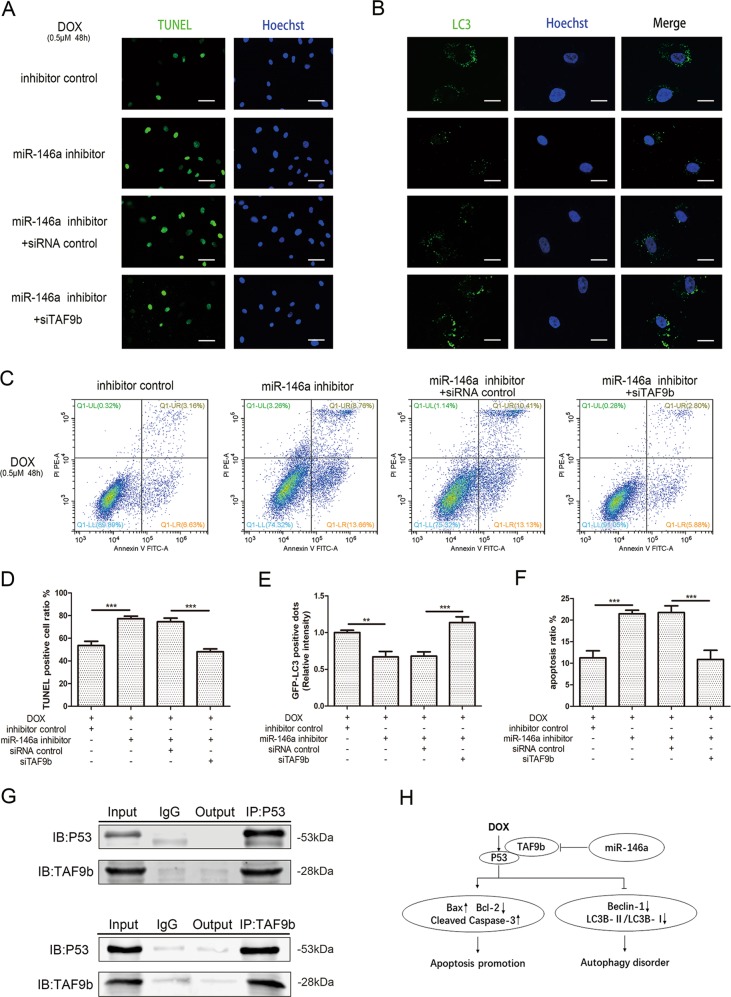
Fig. 4. MiR‐146a in AC16s inhibited DOX‐induced cardiotoxicity by suppressing TAF9b/P53 pathway.
a, d TUNEL-staining analysis was used to detected nuclear fragmentation after transfection. Scale bar indicated 50 μm. The percentage of TUNEL-positive cells in each group according to Hoechst nuclear staining was indicated. b, e Representative fluorescence microscopy images of GFP-LC3-transfected cells treated as indicated. Scale bar indicated 20 μm. The relative GFP-LC3-positive dots were calculated according to the fluorescence intensity. c, f Apoptosis was then analyzed by staining with propidium iodide (PI, y-axis) and annexin V-FITC (x-axis). The percentage of PI-positive cells in each quadrant were indicated to represent the apoptotic rate of cells. g Co‐IP experiments were performed to examine the interaction between P53 and TAF9b. Input represents whole cell lysate. IgG stands for isotype control. Output represents the supernatant after Co-IP. IP stands for immunoprecipitation while IB, immunoblotting. h Schematic illustration of the pathway of autophagy and apoptosis regulated by miR-146a in DOX-induced cardiotoxicity. Mean ± SD of three independent experiments. *P < 0.05, **P < 0.01, ***P < 0.001

