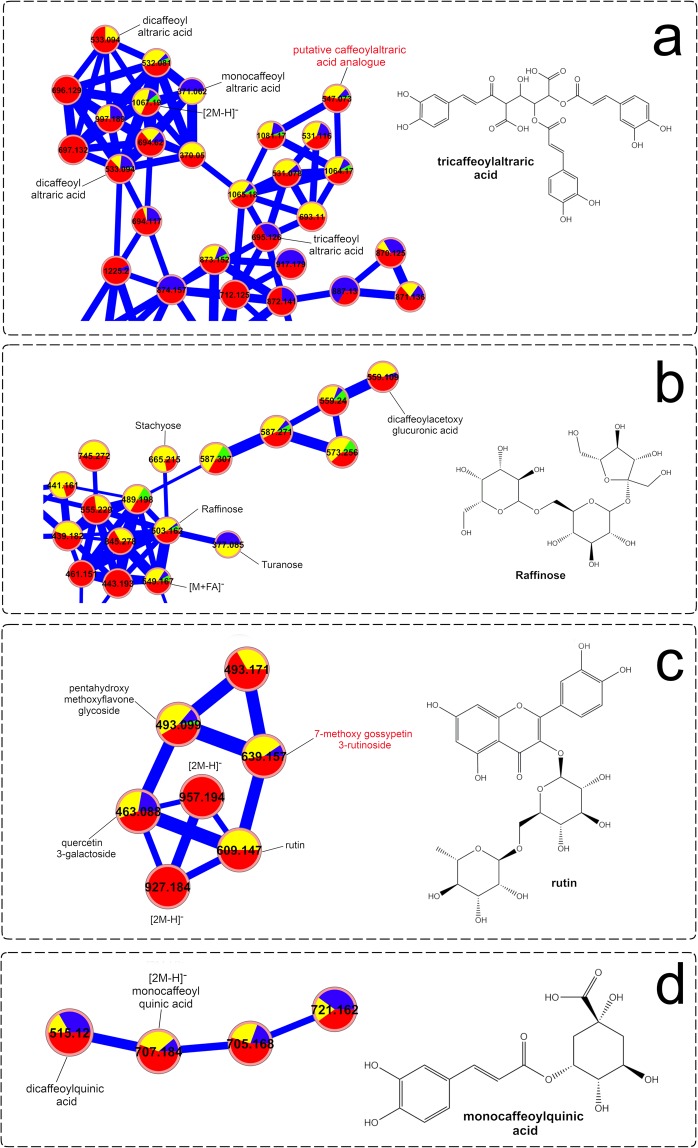
Figure 6.
Molecular networks of Smallanthus sonchifolius’ leaf extracts (analyzed by UHPLC-HRMS/MS in negative mode) showing specific clusters annotated as (a) caffeoylaltraric acids and derivatives, (b) free glycosides, (c) glycosylated flavonoids and (d) chlorogenic acids. The node size represents the mean retention time value of each parent ion with larger nodes representing higher retention times. Node color represents the metabolic developmental stage of the collected samples as follows: green: 0.5 to 1-month-old plants; blue: 1.5-month-old plants; yellow: 2 to 4-month-old plants and red: 4.5 to 6-month-old plants. Edge width depicts the cosine similarity between different MS/MS spectra (0.65 < r > 0.95) with thicker edges representing higher cosine scores.

