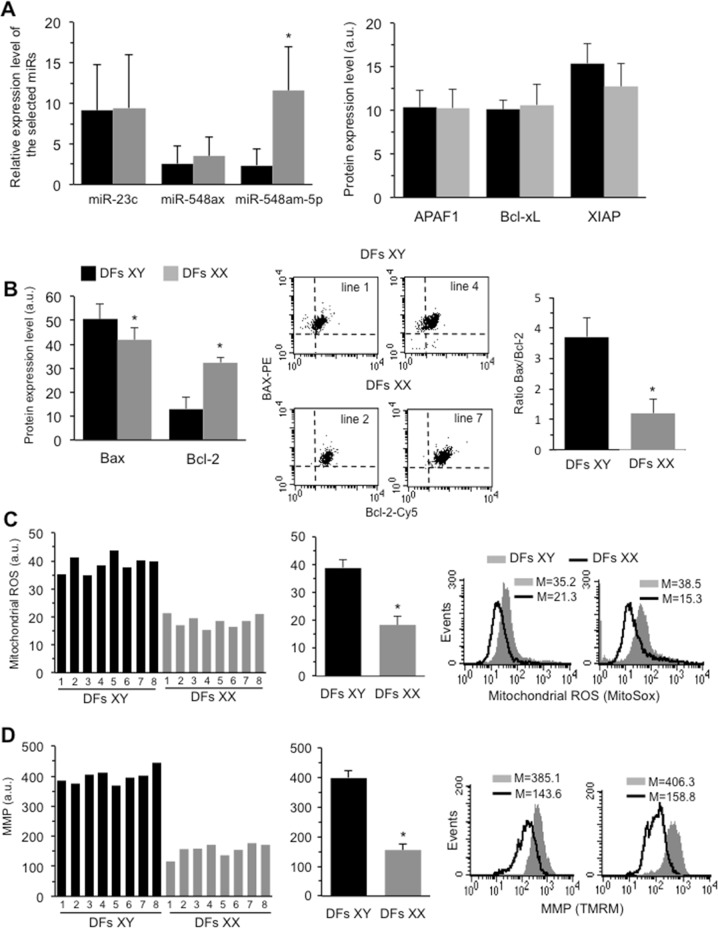
Fig. 1.
a Left panel: Expression level of the selected microRNAs in XX and XY DFs as quantitatively measured by qRT-PCR. The values of fold increase were calculated by the 2−ΔΔCt method for each sample relative to the overall female or male samples mean. The fold increase values were obtained from eight female and eight male donors estimated in two independent quantitation reactions, with triplicate wells for each sample and for each microRNA. Right panel: Cytofluorimetric analysis of APAF1, Bcl-xL, and XIAP expression level in DFs isolated from eight male and eight female healthy donors obtained in three independent measures performed in each donor and reported as mean ± SD of the median fluorescence intensity. No statistically significant differences were evident between male and female DFs. b Left panel: Cytofluorimetric analysis of Bax and Bcl-2 expression level in DFs isolated from eight male and eight female (right panel) healthy donors obtained in three independent measures performed in each donor and reported as mean ± SD of the median fluorescence intensity. Central panel: Dot plots obtained in two representative XY and XX DFs after double cell staining with Bax and Bcl-2 specific antibodies. Right panel: Bar graph showing the ratio Bax/Bcl-2 obtained by pooling together measures acquired in DFs isolated from all the male or female donors. c Left panel: Bar graph showing a representative flow cytometric evaluation, performed by using MitoSOX-red, of mitochondrial ROS production in DFs isolated from eight male and eight female healthy donors. Central panel: Bar graph showing mitochondrial ROS production obtained by pooling together measures acquired in DFs isolated from all the male or female donors and reported as mean ± SD of the median fluorescence intensity. Right panels: Cytofluorimetric histograms of mitochondrial ROS evaluation obtained in two representative male and female DFs. d Left panel: Bar graph showing a representative flow cytometric evaluation, performed by using TMRM, of mitochondrial membrane potential (MMP) in DFs isolated from eight male and eight female healthy donors. Central panel: Bar graph showing MMP obtained by pooling together measures acquired in DFs isolated from all the male or female donors and reported as mean ± SD of the median fluorescence intensity. Right panels: Cytofluorimetric histograms of MMP evaluation obtained in two representative XY and XX DFs. Black columns XY DFs; gray columns XX DFs. *p < 0.01 between XY and XX DFs

