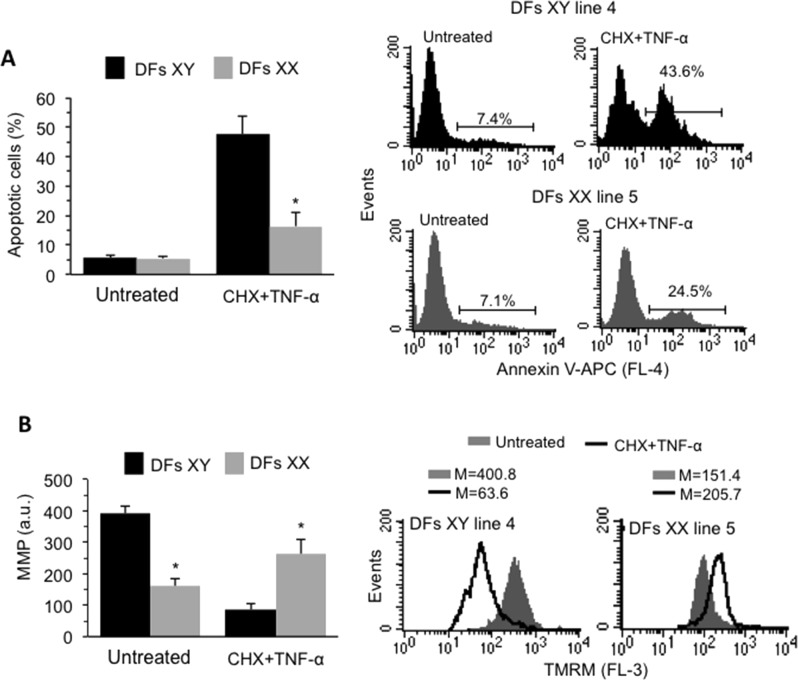
Fig. 2.
a Left panel: Bar graph showing flow cytometry analysis after staining with Annexin V-APC obtained in DFs isolated from eight male and eight female healthy donors reported as means ± SD. Right panel: Flow cytometry histograms of apoptosis evaluation obtained in one representative cell line of XY and XX DFs. Numbers represent the percentages of Annexin V-positive cells. b Left panel: Bar graph showing MMP obtained by pooling together measures acquired in DFs isolated from all the male or female donors and reported as mean ± SD of the median fluorescence intensity. Right panels: Cytofluorimetric histograms of MMP evaluation obtained in one representative cell line of XY and XY DFs. *p < 0.01 between XY and XX DFs

