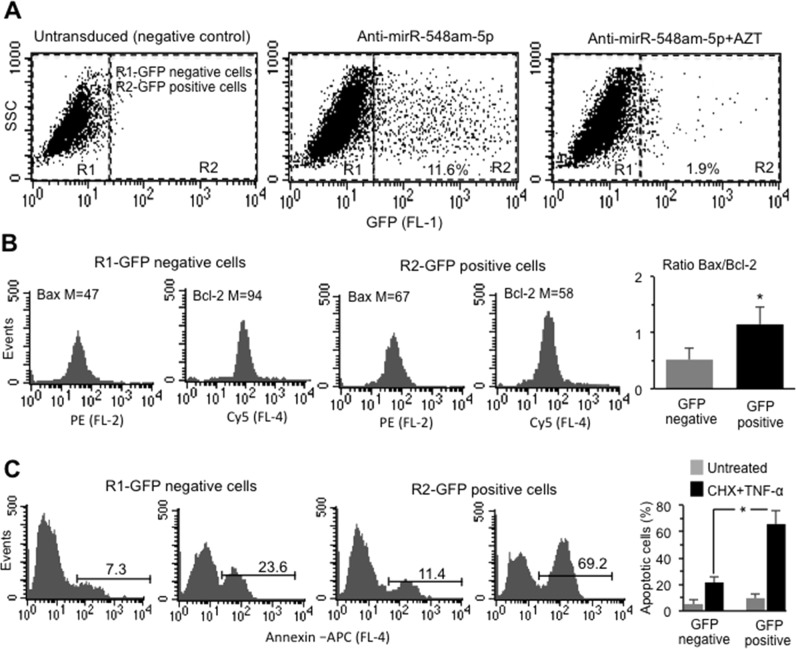
Fig. 4.
a Side scatter vs (FL1) GFP dot plots obtained in one representative XX DFs cell line untransduced or transduced with GFP-anti-miR548am-5p in the presence or absence of AZT. Numbers indicate the percentage of GFP-positive cells. b Cytofluorimetric histograms of Bax and Bcl-2 expression level in GFP-negative and -positive cells obtained in one representative XX DFs cell line after transduction with GFP-anti-miR548am-5p. Numbers indicate the median fluorescence intensity. Bar graph on the right shows the ratio Bax/Bcl-2 of four XX DFs cell lines. *p < 0.01 between GFP-positive and GFP-negative cells. c Flow cytometry histograms of apoptosis evaluation in GFP-positive or -negative cells of one representative XY DFs cell line after transduction with GFP-anti-miR548am-5p treated or not with CHX+TNF-α. Numbers represent the percentages of Annexin V-positive cells. Bar graph showing flow cytometry analysis after cell staining with Annexin V-APC performed in triplicate and reported as means ± SD of four XX DFs cell lines

