Fig. 1.
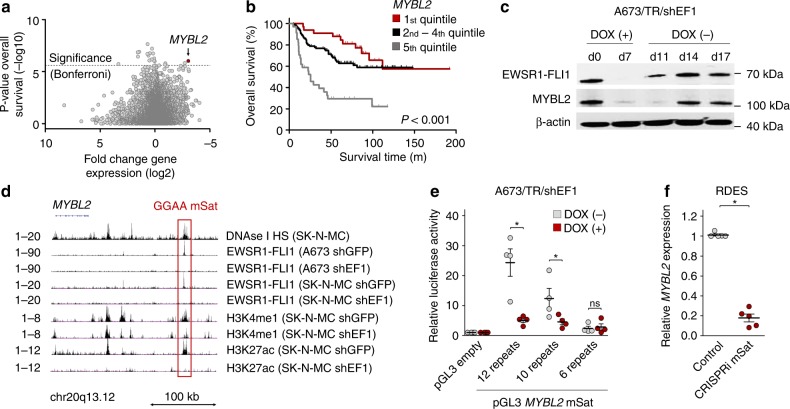
MYBL2 is a clinically relevant direct EWSR1-FLI1 target gene regulated via a polymorphic GGAA-microsatellite. a Integrative analysis of gene expression microarrays of A673/TR/shEF1 cells profiled with/without DOX addition with 166 clinically annotated EwS transcriptomes; P values determined via Mantel–Haenszel test. The dashed line indicates the Bonferroni-adjusted P value threshold. b Kaplan-Meier survival analysis of 166 EwS patients stratified by quintile MYBL2 expression; P value determined via Mantel–Haenszel test. c Western blot using antibodies against (EWSR1)-FLI1 and MYBL2 in A673/TR/shEF1 cells. EWSR1-FLI1 was silenced for 7 days by DOX-treatment and re-expressed after DOX-removal for 10 days. Loading control: β-actin. d Epigenetic profile of the MYBL2 locus in indicated EwS cells transduced with either a control shRNA (shGFP) or a specific shRNA against EWSR1-FLI1 (shEF1) from published DNAse-seq (DNAse I hypersensitivity (HS)) data and ChIP-seq data for EWSR1-FLI1, H3K4me1, and H3K27ac. e Reporter assays of MYBL2-associated GGAA-microsatellite (mSat) haplotypes in A673/TR/shEF1 cells treated with/without DOX. Horizontal bars represent means, and whiskers represent the SEM, n = 4 biologically independent experiments; P values determined via one-tailed Mann–Whitney test. f Analysis of relative MYBL2 expression by qRT-PCR in RDES EwS cells with/without CRISPRi-mediated targeting of the MYBL2-associated GGAA-microsatellite. Horizontal bars represent means, and whiskers represent the SEM, n = 5 biologically independent experiments; P values determined via two-tailed Mann–Whitney test. Not significant, ns; *P < 0.05. Source data are provided as a Source Data file

