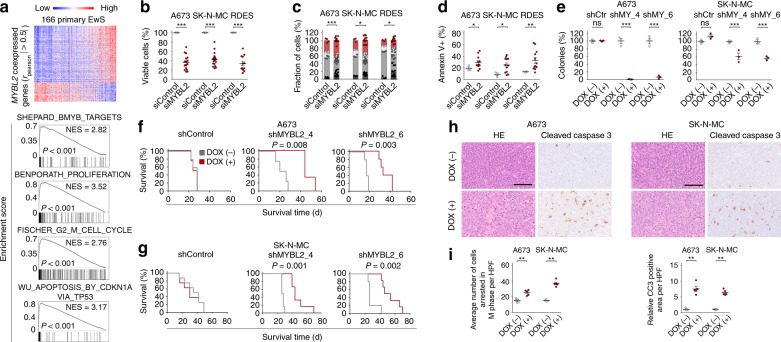
Fig. 2.
MYBL2 is critical for proliferation and cell survival of EwS cells in vitro and in vivo. a Upper: Heat-map of genes whose expression is positively or negatively correlated with MYBL2 in 166 primary EwS. Lower: GSEA of the same dataset showing selected gene-sets enriched in MYBL2 high-expressing tumors. b Viable cell count 96 h after transfection of three EwS cell lines with either four different specific siRNAs against MYBL2 (summary of four different siRNAs shown) or a non-targeting siControl. Horizontal bars represent means, and whiskers represent the SEM, n ≥ 3 biologically independent experiments. c Analysis of cell cycle and cell death (sub G1/G0) 96 h after transfection of three EwS cell lines as described in b, using PI staining. Dots show the percentages of cells per experiment delineating cell cycle phases, bars show the fraction of cells (%) in each cell cycle phase, n ≥ 3 biologically independent experiments. d Analysis of apoptosis 96 h after transfection of three EwS cell lines as described in b, using Annexin V/PI staining. Horizontal bars represent means, and whiskers represent the SEM, n = 3 biologically independent experiments. e Relative colony number of A673 and SK-N-MC cells containing either DOX-inducible specific shRNA constructs directed against MYBL2 (shMY_4 refers to shMYBL2_4 and shMY_6 refers to shMYBL2_6) or a non-targeting shControl (shCtr). Cells were grown either with or without DOX. Horizontal bars represent means, and whiskers the SEM, n = 3 biologically independent experiments. f, g Kaplan–Meier survival analysis of NSG mice xenografted with A673 or SK-N-MC cells with/without DOX-inducible MYBL2 suppression. Once tumors were palpable, mice were randomized and treated with either vehicle (–) or DOX (+), n ≥ 4 animals per condition. P values determined via Mantel–Haenszel test. h Representative micrographs of xenografts stained with hematoxylin and eosin (HE) or for cleaved caspase 3 (CC3) by IHC. Scale bar is 100 µm. i Quantification of cells arrested in M-phase and automated quantification of the picture area positive for CC3 (relative to control) of micrographs described in h. Horizontal bars represent means, and whiskers represent the SEM, n = 5 samples per condition. ***P < 0.001, **P < 0.01, *P < 0.05; P values determined via two-tailed Mann–Whitney test. Source data are provided as a Source Data file

