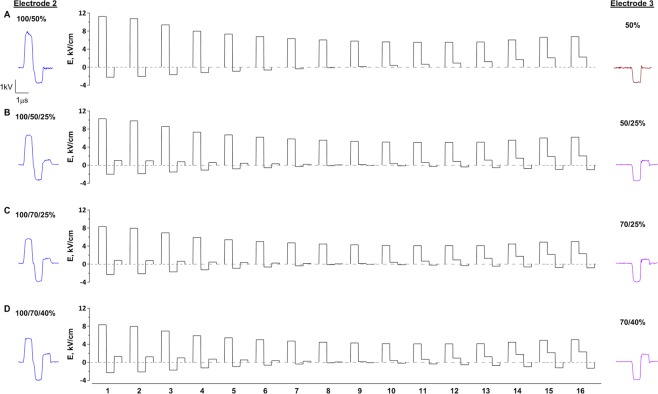
Figure 3.
Stimulus shapes formed by the superposition of bipolar pulses along the line between two active electrodes. The distance between electrodes 2 and 3 (see Fig. 2A) was split into 16 equal segments which correspond to the regions of interest for fluorescence measurements. Rows (A–D) correspond to different stimulation conditions employed for experiments presented in Figs 4 and 5. Pulses delivered to electrodes 2 and 3 (actual oscilloscope traces) and their phase ratios are shown in each row in the left and right panels, respectively (the first phase delivered to electrode 2 is taken as 100%). Pulses delivered to electrode 3 omit the first phase and start with a 600 ns delay, as explained in Figs 1B and 2. Electric field simulations for the middle panels assumed idealized (rectangular) shape of all phases of delivered pulses.

