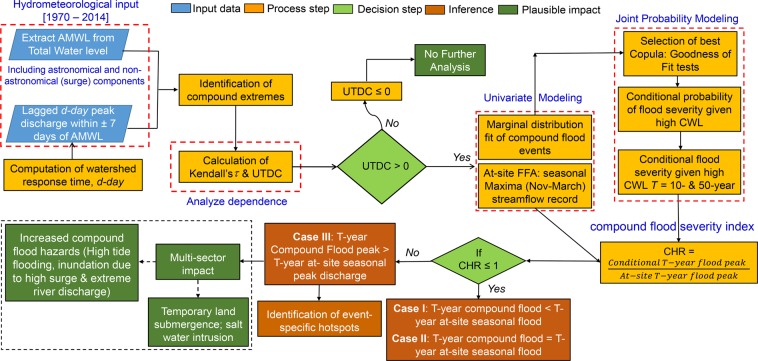
Figure 1.
Workflow for analyses of compound flooding and Identification of hotspots; FFA, CHR, UTDC, CWL, AMWL, and T denote Flood Frequency Analysis, Compound Hazard Ratio, Upper Tail Dependence Coefficients, Coastal Water Level, Annual Maxima Water Level, and return period, respectively. The flowchart is prepared in MS Office Power Point 2010 and then organized in Adobe Photoshop CS6 Desktop (Version 13.0.1 × 32, http://www.adobe.com) [Software].

