Figure 5.
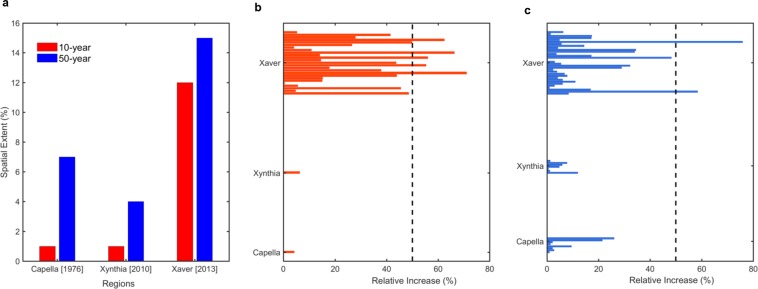
The fraction of TG-SG pairs showing an increase in the likelihood of compound flood hazards for the three winter storm episodes (a) Fraction (expressed as a percentage) of TG-SG pair with an increase in T-year peak discharge associated with compound event relative to at-site peak discharge. Percentage relative increase in T-year peak discharge for (b) 10- and (c) 50-year events. The increase in discharge is quantified as the relative difference between the magnitude of the T-year flood peak conditional on AMWL and the seasonal maxima (November-March) at-site T-year peak discharge expressed as a percentage. The horizontal bars in red (figure b) and blue (Figure c) show TG-SG pairs with an increase in flood hazard. The dotted vertical line (in black) indicates the relative increase of the order of 50%. Figures are generated using MATLAB 2015a (Version 8.5, http://www.mathworks.com), and then organized and labelled in Adobe Photoshop CS6 Desktop (Version 13.0.1 × 32, http://www.adobe.com) [Software].

