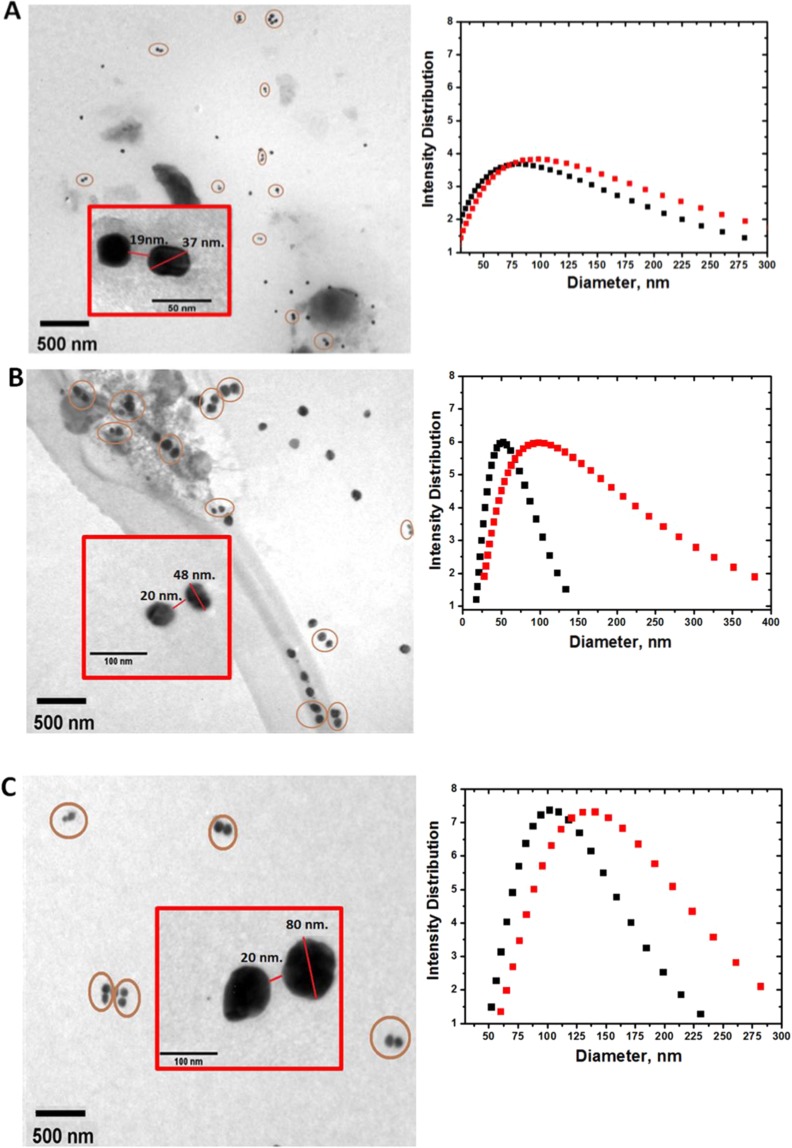
Figure 2.
Transmission Electron Microscopy images and Dynamic Light Scattering response of the Ag nanostructures formed 30 minutes after adding different gliadin-specific biotinylated IgG concentrations. (A) TEM images of 38 nm diameter Ag NPs/0.75 ng/mL IgG-Biot and DLS analysis plot of the isolated Ag NPs. (B) TEM image of 46 nm diameter Ag NPs/0.5 ng/mL IgG-Biot and DLS analysis plot of the isolated Ag NPs. (C) TEM image of 76 nm Ag NPs/0.25 ng/mL IgG-Biot and DLS analysis plot of the isolated Ag NPs. Red squares show image magnifications of the Ag nanostructures formed 30 minutes after adding IgG-Biot.

