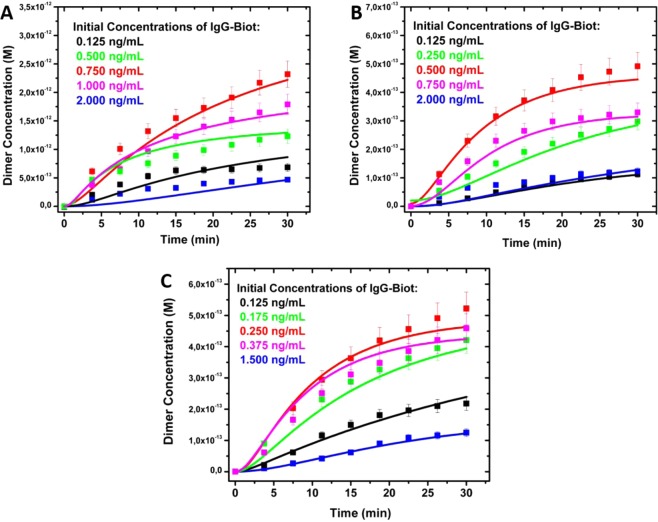
Figure 3.
Experimental (squared symbols) and kinetics modelling (solid lines) of the evolution of the dimer concentration for different Ag NPs sizes and initial biotinylated IgG (IgG-Biot) concentrations. (A) 38 nm diameter Ag NPs, (B) 46 nm diameter Ag NPs, (C) 76 nm diameter Ag NPs. The initial IgG-Biot concentrations are indicated in the inset of each plot. The reaction mechanism and the kinetic rate constants are depicted in Table 1.

