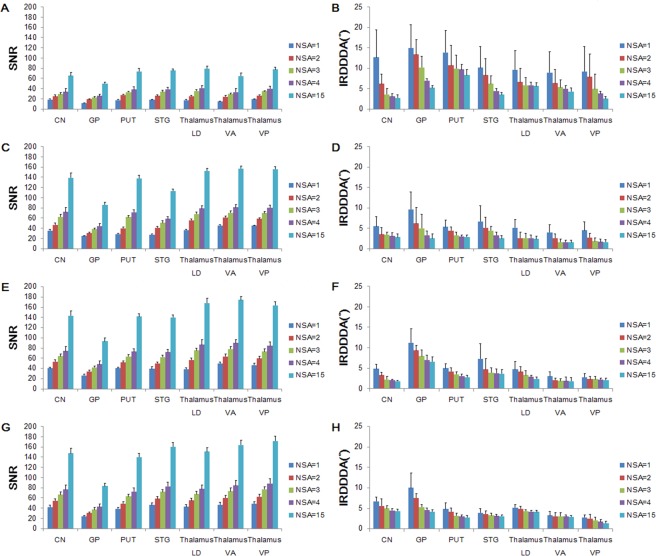
Figure 1.
Signal-to-noise ratio (SNR) and intra-ROI diffusion direction dispersion angle (IRDDDA) of brain ROIs for different number of signal averages (NSA) at 1.5 T Philips (A,B), 3 T Philips (C,D), 3 T Siemens (E,F) and 3 T GE (G,H) systems. T bars represent standard deviations. Abbreviations: CN, caudate nucleus; GP, globus pallidus; LD, lateral dorsal; NSA, number of signal average; PUT, putamen; ROI, region-of-interest; SNR, signal-to-noise ratio; STG, superior temporal gyrus; VA, ventral anterior; VP, ventral posterior.

