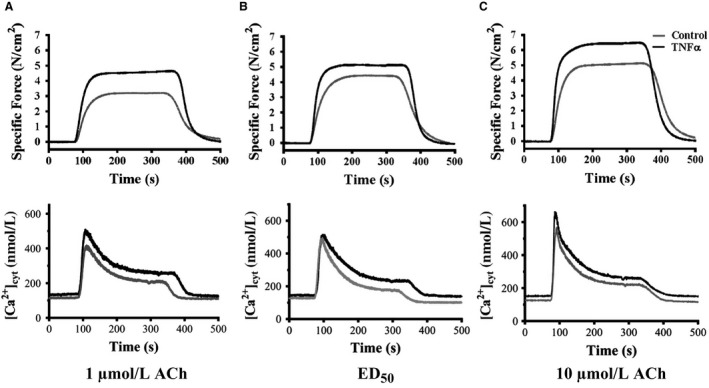
Figure 4.

Representative tracings of ACh‐induced elevation of [Ca2+]cyt and increased specific force in control and TNFα‐exposed (100 ng/mL, 24 h) ASM strips at three different ACh concentrations. (A) 1 μmol/L ACh; (B) 1.3 μmol/L ACh for control (EC50 ) and 2.6 μmol/L ACh for TNFα (EC50 ); (C) ACh 10 μmol/L. ACh, acetylcholine; TNFα, tumor necrosis factor alpha.
