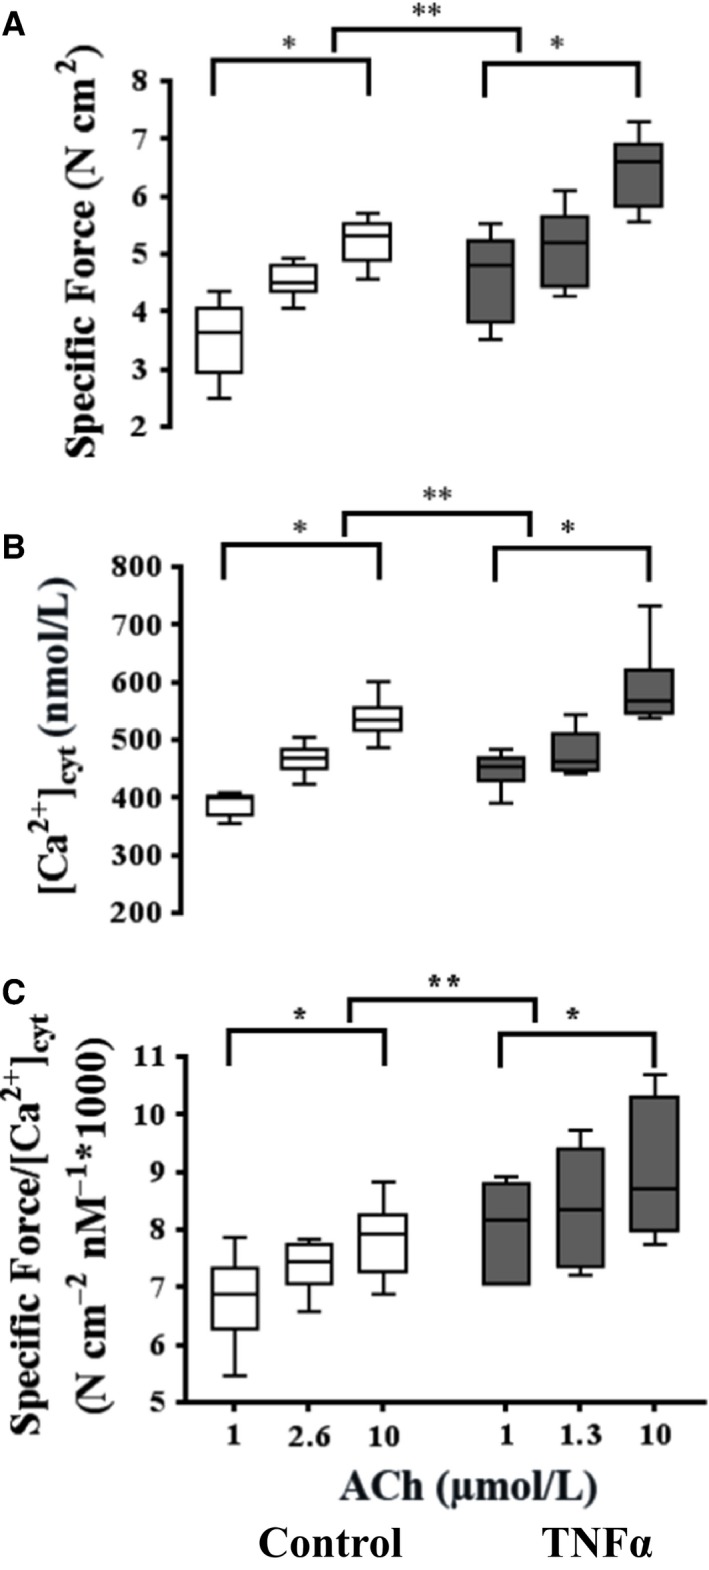
Figure 5.

Summary of the specific force (A) and peak [Ca2+]cyt (B) responses induced by ACh at three different concentrations (control: 1, 2.6 [EC50], and 10 μmol/L; TNF: 1, 1.3 [EC50], 10 and 10 μmol/L). Exposure to TNFα (100 ng/mL, 24 h) significantly increased ASM‐specific force across all ACh concentrations (A). TNFα exposure significantly increased the peak amplitude of the ACh‐induced [Ca2+]cyt response except at the EC50 concentration (B). Due to the disproportionate increase in specific force induced by TNFα exposure, Ca2+ sensitivity (force per [Ca2+]cyt) significantly increased (C). Values are medians – IQR. *Significant difference (P < 0.05) versus initial 1 μmol/L ACh for each group (n = 6 animals). **Significant interaction between ACh concentration dependence and treatment group. ACh, acetylcholine; TNFα, tumor necrosis factor alpha; ASM, airway smooth muscle; IQR, interquartile range.
