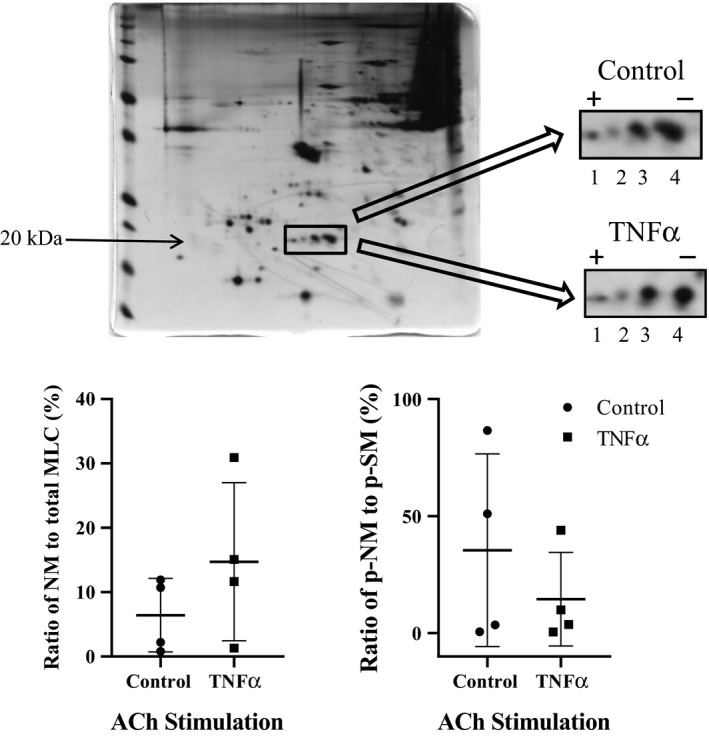
Figure 7.

Representative silver‐stained 2‐D gel used for quantifying phosphorylated (dots 1 and 3) and nonphosphorylated (dots 2 and 4) NM and SM rMLC, respectively, in control and TNFα‐treated (100 ng/mL, 24 h) porcine ASM. Exposure to TNFα significantly increased the ratio of NM myosin to total rMLC at the baseline. After ACh stimulation at the EC50 concentration (2.6 μmol/L for control and 1.3 for TNFα‐treated ASM), the ratio of phosphorylated NM rMLC to phosphorylated SM rMLC was reduced in TNFα‐treated ASM strips. Values for each of the four animals are presented. NM, nonmuscle; SM, smooth muscle; rMLC, regulatory myosin light chain; TNFα, tumor necrosis factor alpha; ASM, airway smooth muscle; ACh, acetylcholine.
